Fig. 10.
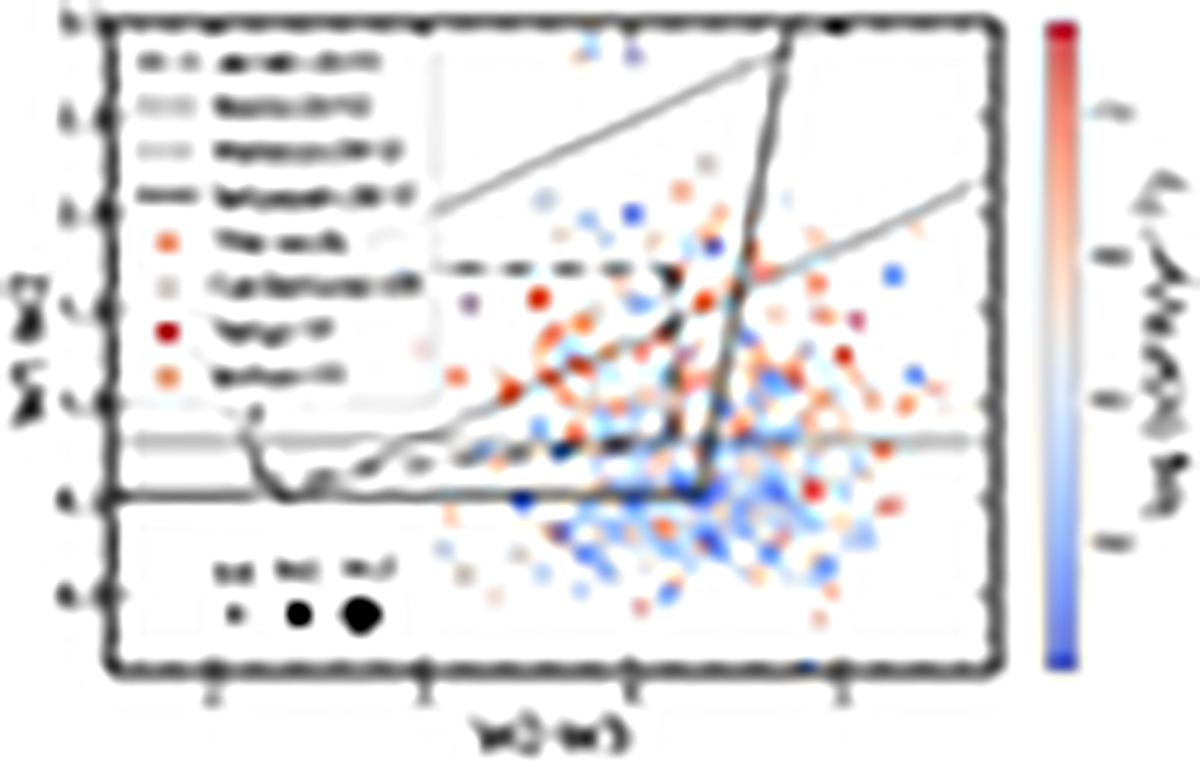
Download original image
WISE W1 − W2 versus W2 − W3 diagram of BBs, GPs, and BDGs. All points are colored based on the galaxies’ sSFRs. The samples of Cardamone et al. (2009) GPs, Izotov et al. (2011) BDGs, Yang et al. (2017), and this work’s BBs are shown with rhombus, circle, square, and diamond markers, respectively. The size of the markers is based on the power of the logarithm of the stellar mass of each galaxy and is indicated in the bottom-left corner of the figure. The black dashed-dotted, gray continuous, black dotted, and black continuous lines respectively show the Jarrett et al. (2011), Stern et al. (2012), Mateos et al. (2012), and Satyapal et al. (2018) wedges used to identify AGNs and quasars.
Current usage metrics show cumulative count of Article Views (full-text article views including HTML views, PDF and ePub downloads, according to the available data) and Abstracts Views on Vision4Press platform.
Data correspond to usage on the plateform after 2015. The current usage metrics is available 48-96 hours after online publication and is updated daily on week days.
Initial download of the metrics may take a while.