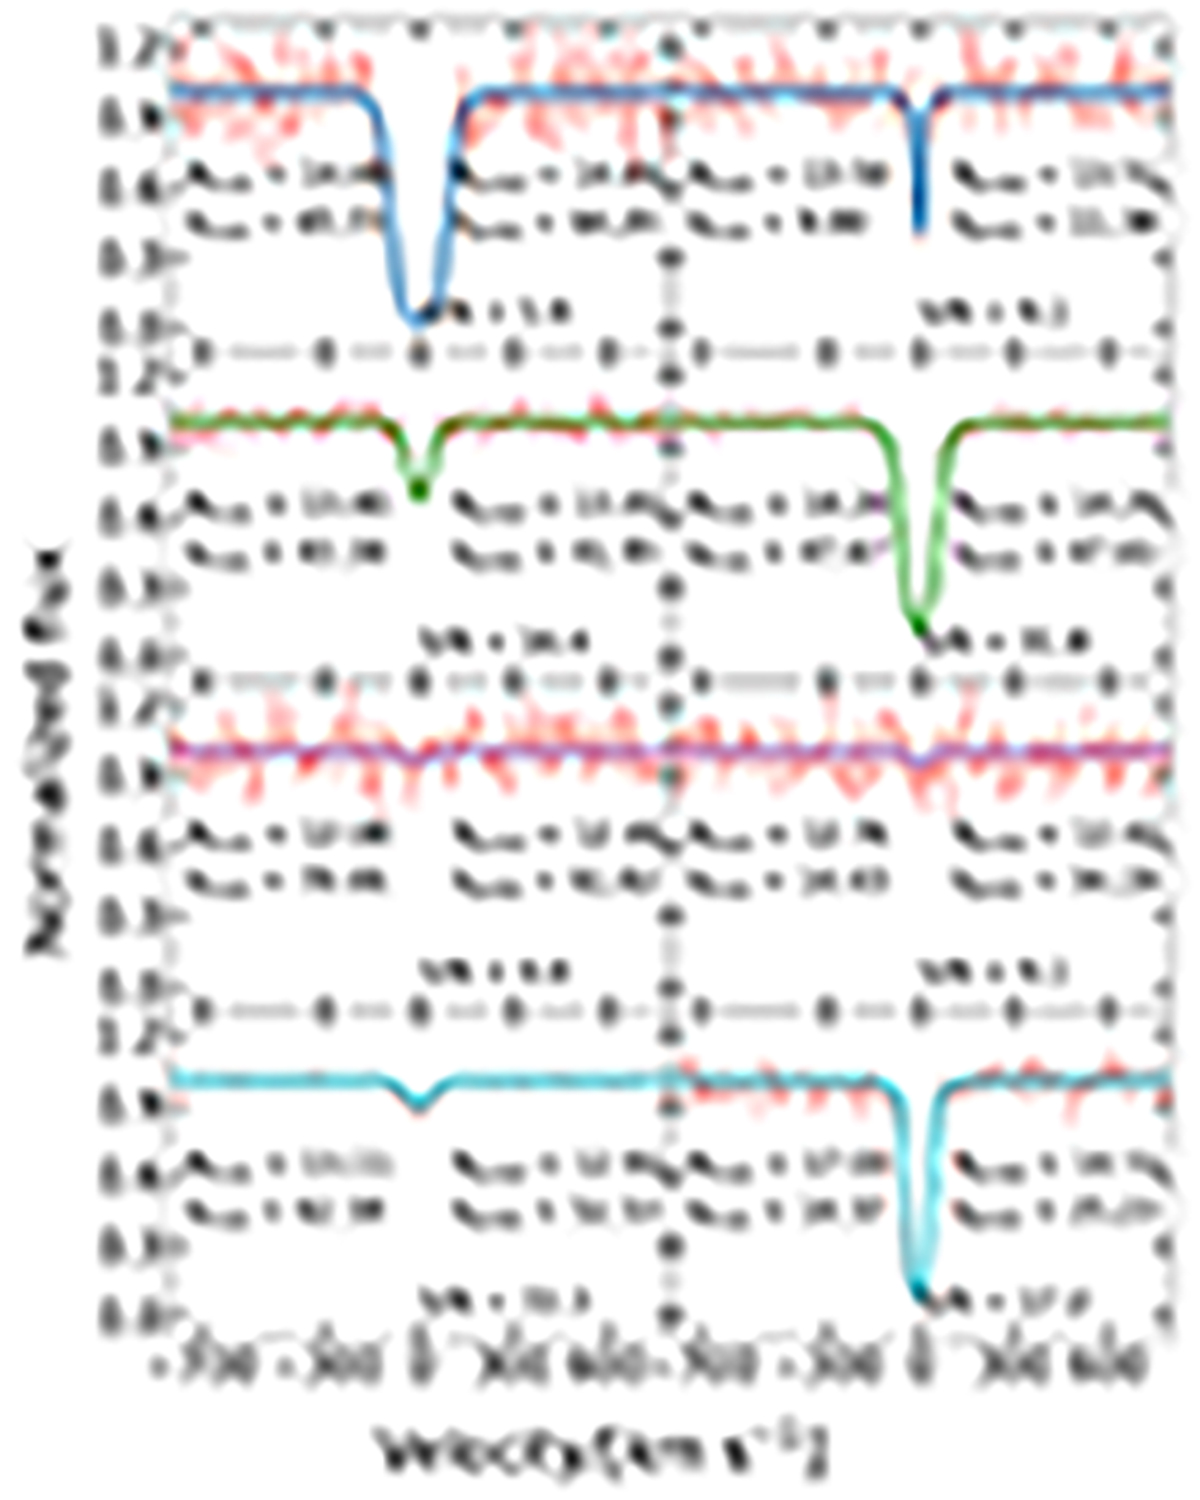
Fig. 9.
Download original image
Examples of the simulated test single absorption lines and the corresponding Voigt profile predicted by the CNN model (in colors). The input data, consisting of 301 pixels generated in Sect. 3, are shown as red dashed lines. The true and predicted parameters are written in each panel. The figures in the upper panel demonstrate precise physical parameter predictions made by the CNN for low-S/N data (blue), while the second panel displays higher-S/N data (green). The two lower panels illustrate two instances of an inaccurate prediction made by CNN for low- (purple) and high-S/N (cyan). To be considered an accurate prediction, the criterion is |Ntrue–Npred|< 0.33 cm−2 (σ90N in log scale) and |btrue–bpred|< 7.8 km s−1 (σ90b). Alternatively, |Ntrue–Npred|≥0.33 cm−2 and |btrue–bpred|≥7.8 km s−1 serve as the criterion for inaccurate prediction.
Current usage metrics show cumulative count of Article Views (full-text article views including HTML views, PDF and ePub downloads, according to the available data) and Abstracts Views on Vision4Press platform.
Data correspond to usage on the plateform after 2015. The current usage metrics is available 48-96 hours after online publication and is updated daily on week days.
Initial download of the metrics may take a while.