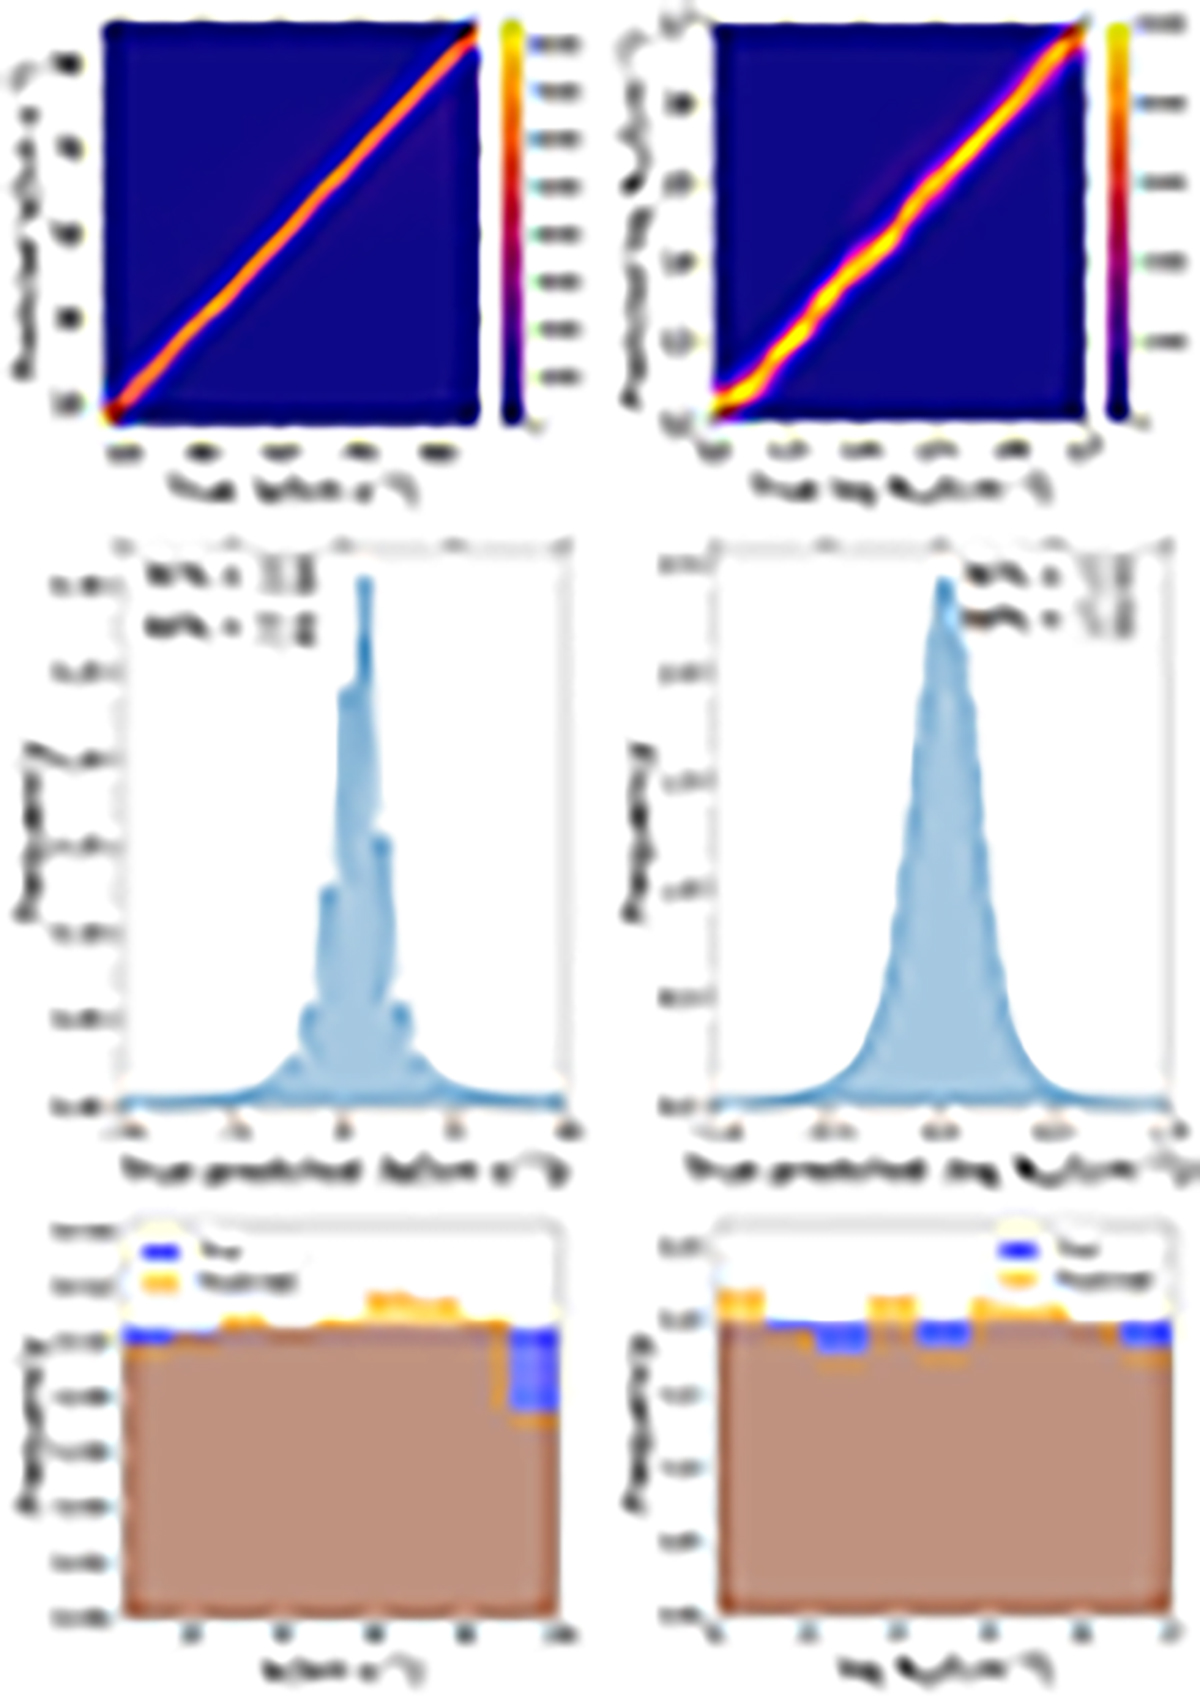
Fig. 8.
Download original image
Comparison and evaluation of the predicted and true parameters for simulated test single absorption line. The upper panel compares the actual and predicted values for the two parameters, b and NHI. The middle panel exhibits the normalized distribution of the differences between the predicted and true values, with markers for the 90% and 68% percentiles. The bottom panels show the normalized histogram of the CNN-predicted values in comparison to the true labels.
Current usage metrics show cumulative count of Article Views (full-text article views including HTML views, PDF and ePub downloads, according to the available data) and Abstracts Views on Vision4Press platform.
Data correspond to usage on the plateform after 2015. The current usage metrics is available 48-96 hours after online publication and is updated daily on week days.
Initial download of the metrics may take a while.