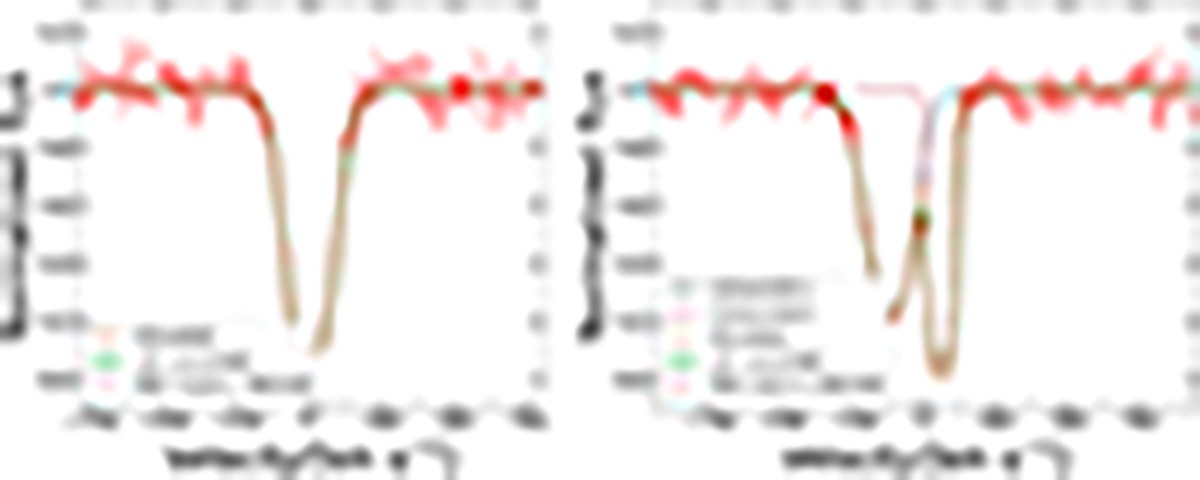
Fig. 2.
Download original image
Simulated Voigt profiles for single and double absorption lines in brown color. The green lines show the absorption lines after convolving with the HST’s tabulated LSF. The red dashed line shows the absorption line after adding the Gaussian noise and rebinning it to a similar velocity frame to the HST data. This red dashed line represents the typical absorption line used as the training dataset in this study. Left panel: brown line shows the simulated Voigt profiles for a single absorption line with NHI = 1014 cm−2, b = 80 km s−1 and S/N = 25. Right panel: same as the left panel but a simulated double absorption line. The dashed lines show two simulated single absorption lines (NHI = 1014.29 and 1015.06 cm−2, b = 92.67 and 25.43 km s−1) that are shifted by ±Δv/2 ∼ 75 km s−1 value and the combined profile is shown in brown color. The training dataset for double absorption lines is shown in red dashed lines.
Current usage metrics show cumulative count of Article Views (full-text article views including HTML views, PDF and ePub downloads, according to the available data) and Abstracts Views on Vision4Press platform.
Data correspond to usage on the plateform after 2015. The current usage metrics is available 48-96 hours after online publication and is updated daily on week days.
Initial download of the metrics may take a while.