Fig. 15.
Download original image
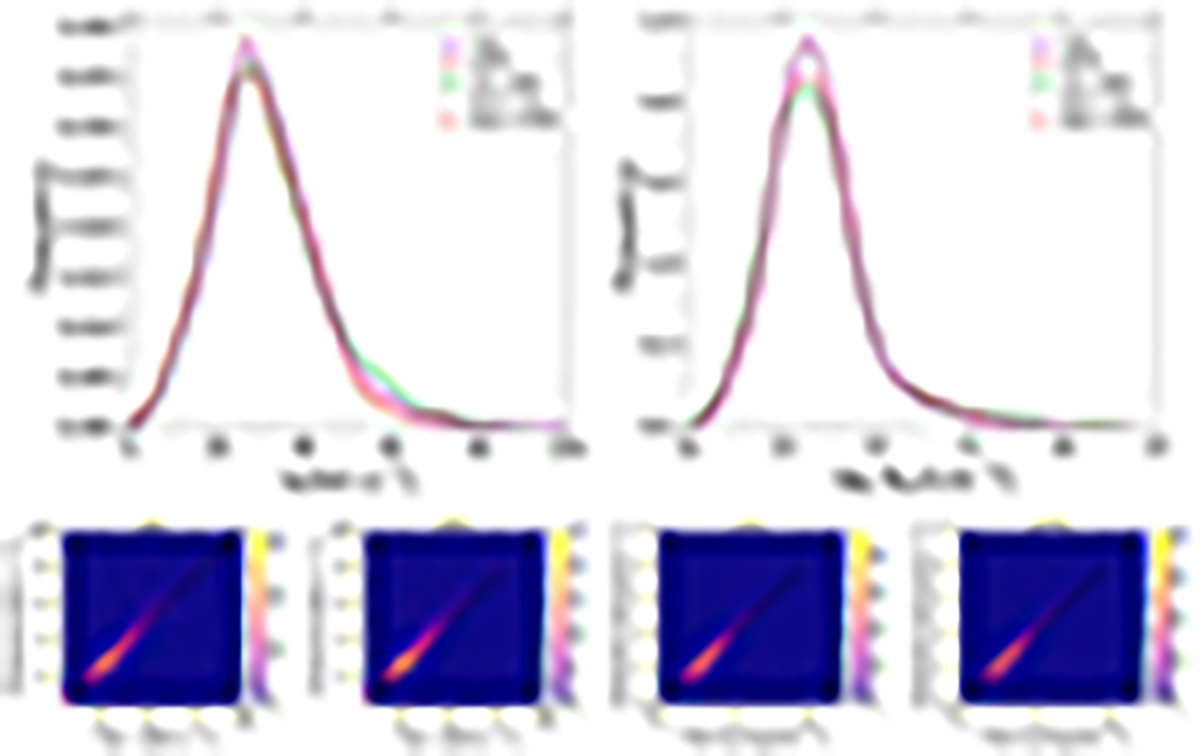
Comparison of true parameter distributions and predictions for real observed single absorption lines. Upper panels: the histograms show the distribution of b and log NHI for a single absorption line common in all three studies estimated by the CNN model in this work (green) overplotted with distributions from D16 (purple) and VIPER (red). The distributions of the CNN predictions for the corresponding mocks are shown in dashed lines.Lower panels: the prediction of single line parameters from CNN compared to the true values from D16 and VIPER.
Current usage metrics show cumulative count of Article Views (full-text article views including HTML views, PDF and ePub downloads, according to the available data) and Abstracts Views on Vision4Press platform.
Data correspond to usage on the plateform after 2015. The current usage metrics is available 48-96 hours after online publication and is updated daily on week days.
Initial download of the metrics may take a while.