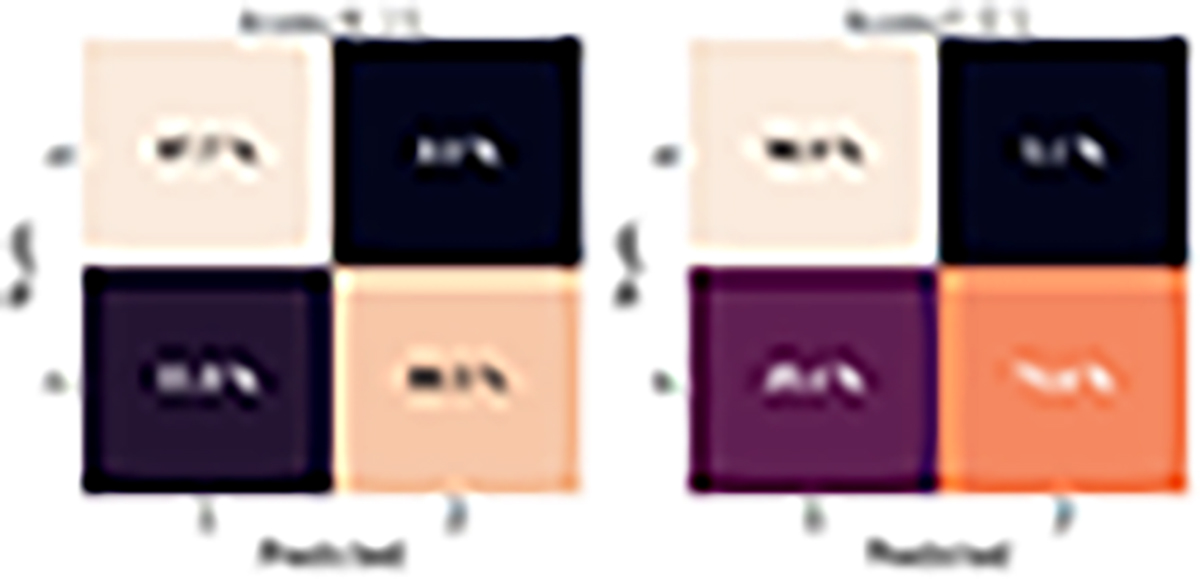
Fig. 13.
Download original image
Examples of classification performance of real observed absorption Lines. Left panel: Successful Classification – The panel displays instances where the classification algorithm accurately identifies single and double absorption lines, effectively matching the true labels. Right panel: Misclassified Cases – The two panels show examples of the misclassified single and double absorption lines, highlighting areas for improvement in certain challenging scenarios.
Current usage metrics show cumulative count of Article Views (full-text article views including HTML views, PDF and ePub downloads, according to the available data) and Abstracts Views on Vision4Press platform.
Data correspond to usage on the plateform after 2015. The current usage metrics is available 48-96 hours after online publication and is updated daily on week days.
Initial download of the metrics may take a while.