Fig. 10.
Download original image
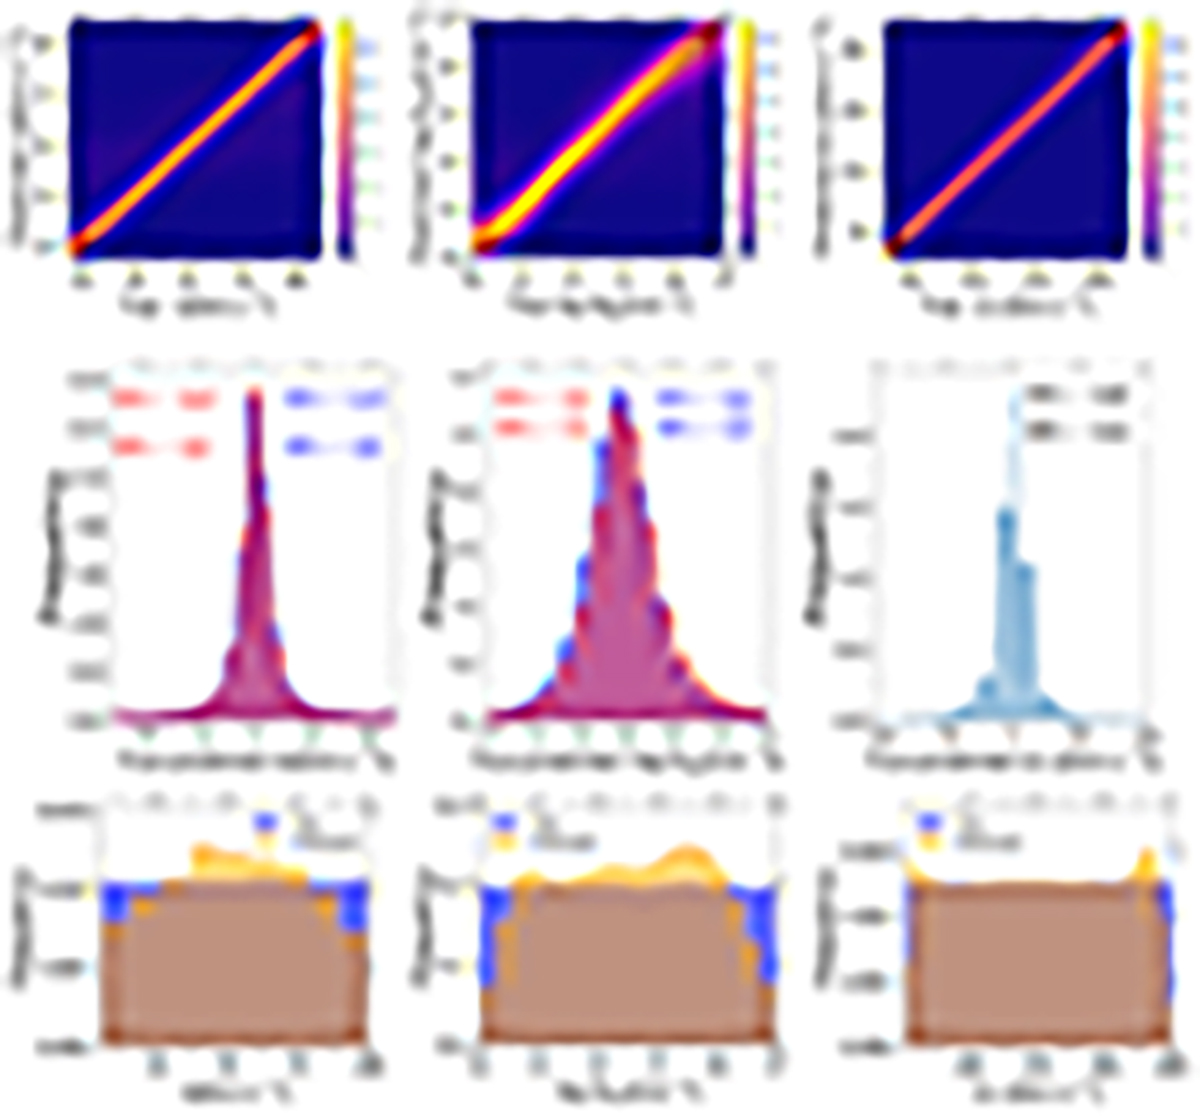
Same as Fig. 8 but for a double absorption line. The upper left panel shows the true versus predicted values stacking b1 and b2. Similarly, the upper middle panels show column density. The right upper panel shows the velocity difference between the two absorption lines. The middle panels show the histogram of the difference between true and predicted values, with 90% and 68% values marked at the top for component 1 (red color) and component 2 (blue color) of the double absorption line. The lower panel shows the normalized histogram of true and predicted parameters.
Current usage metrics show cumulative count of Article Views (full-text article views including HTML views, PDF and ePub downloads, according to the available data) and Abstracts Views on Vision4Press platform.
Data correspond to usage on the plateform after 2015. The current usage metrics is available 48-96 hours after online publication and is updated daily on week days.
Initial download of the metrics may take a while.