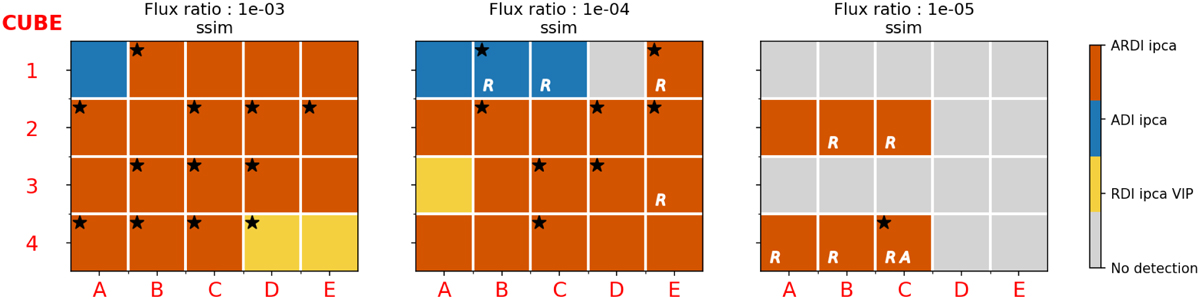
Fig. 6
Download original image
Results of our systematic tests comparing the three strategies RDI, ADI, and ARDI using the IPCA-based algorithm. Each cell represents a different synthetic dataset, combining disk morphologies labeled along the x-axis with datasets before injection along the y-axis. Each figure contains three tables representing three different levels of contrast: 10−3 (left), 10−4 (middle), and 10−5 (right). The color of the cell indicates which algorithm performed best according to the SSIM metric. The white letters on a cell indicate which algorithm(s) did not detect the disk (R → IPCA-RDI, A → IPCA-ADI, AR → IPCA-ARDI). Gray cells mean that no algorithm detected the disk. Black stars indicate that the five metrics (SSIM, Spearman, Pearson, Euclidean, and SAD) selected the same winner.
Current usage metrics show cumulative count of Article Views (full-text article views including HTML views, PDF and ePub downloads, according to the available data) and Abstracts Views on Vision4Press platform.
Data correspond to usage on the plateform after 2015. The current usage metrics is available 48-96 hours after online publication and is updated daily on week days.
Initial download of the metrics may take a while.