Fig. A.1
Download original image
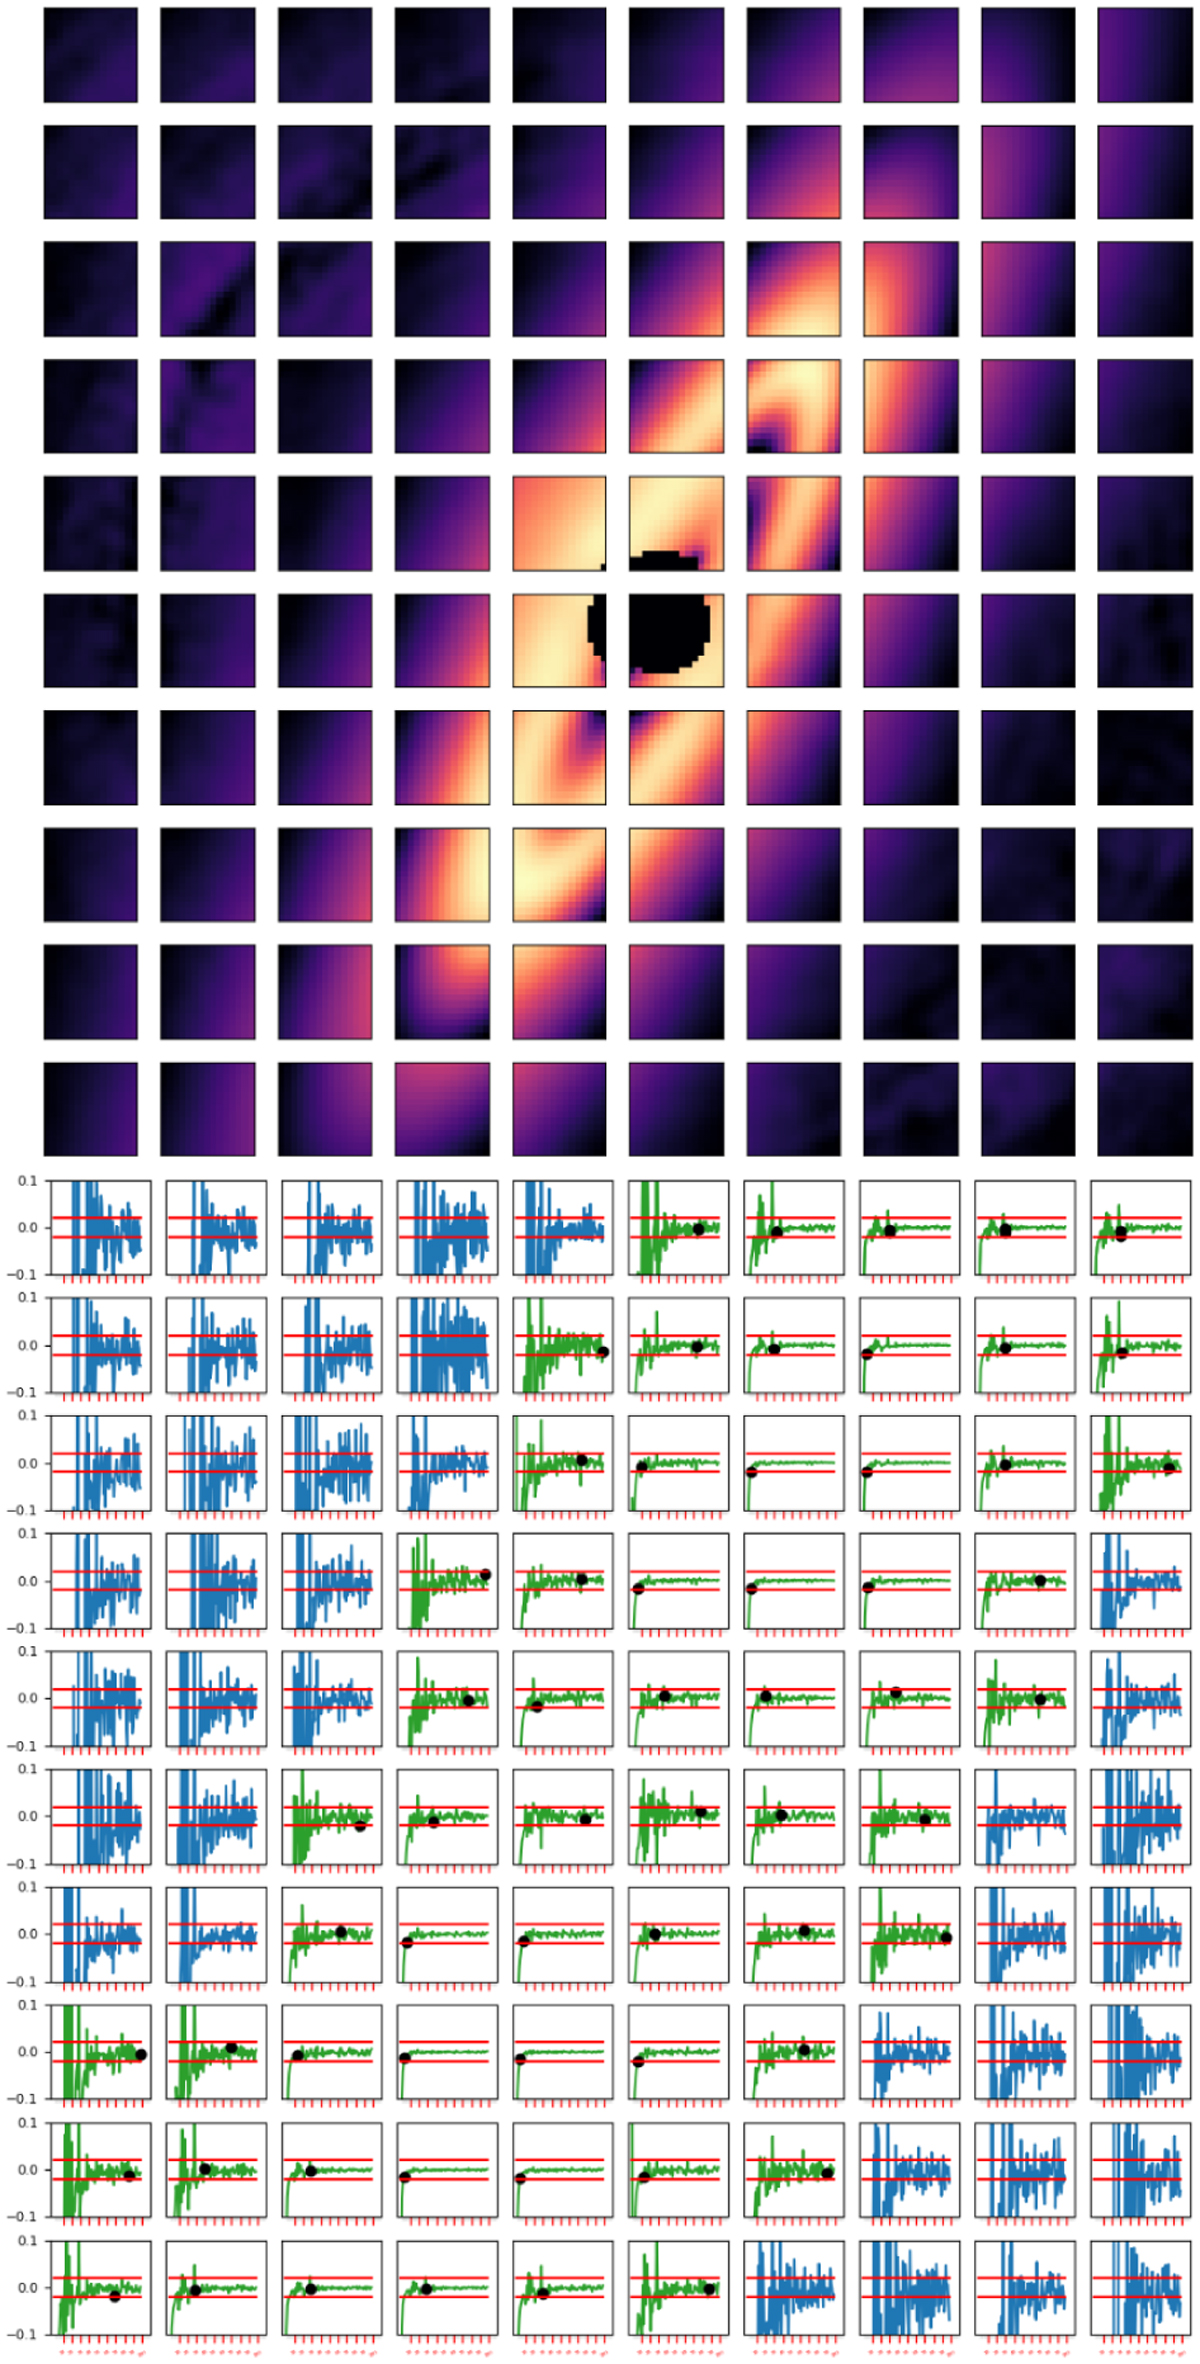
Evolution of the IPCA with ARDI estimate through the iterations. The dataset used is the same as in Fig. 3. The first grid of plots (top) displays the final estimation segmented into patches of size 15 × 15 pixels. The second grid of plots (bottom) corresponds to the gradient computed within these patches according to Eq. 4. The red lines indicate the gtol threshold at ±10−2. If the threshold is reached, the curves are displayed in green, and a black dot indicates at which iteration the signal has converged. Otherwise, the curves are displayed in blue.
Current usage metrics show cumulative count of Article Views (full-text article views including HTML views, PDF and ePub downloads, according to the available data) and Abstracts Views on Vision4Press platform.
Data correspond to usage on the plateform after 2015. The current usage metrics is available 48-96 hours after online publication and is updated daily on week days.
Initial download of the metrics may take a while.