Open Access
Fig. 16
Download original image
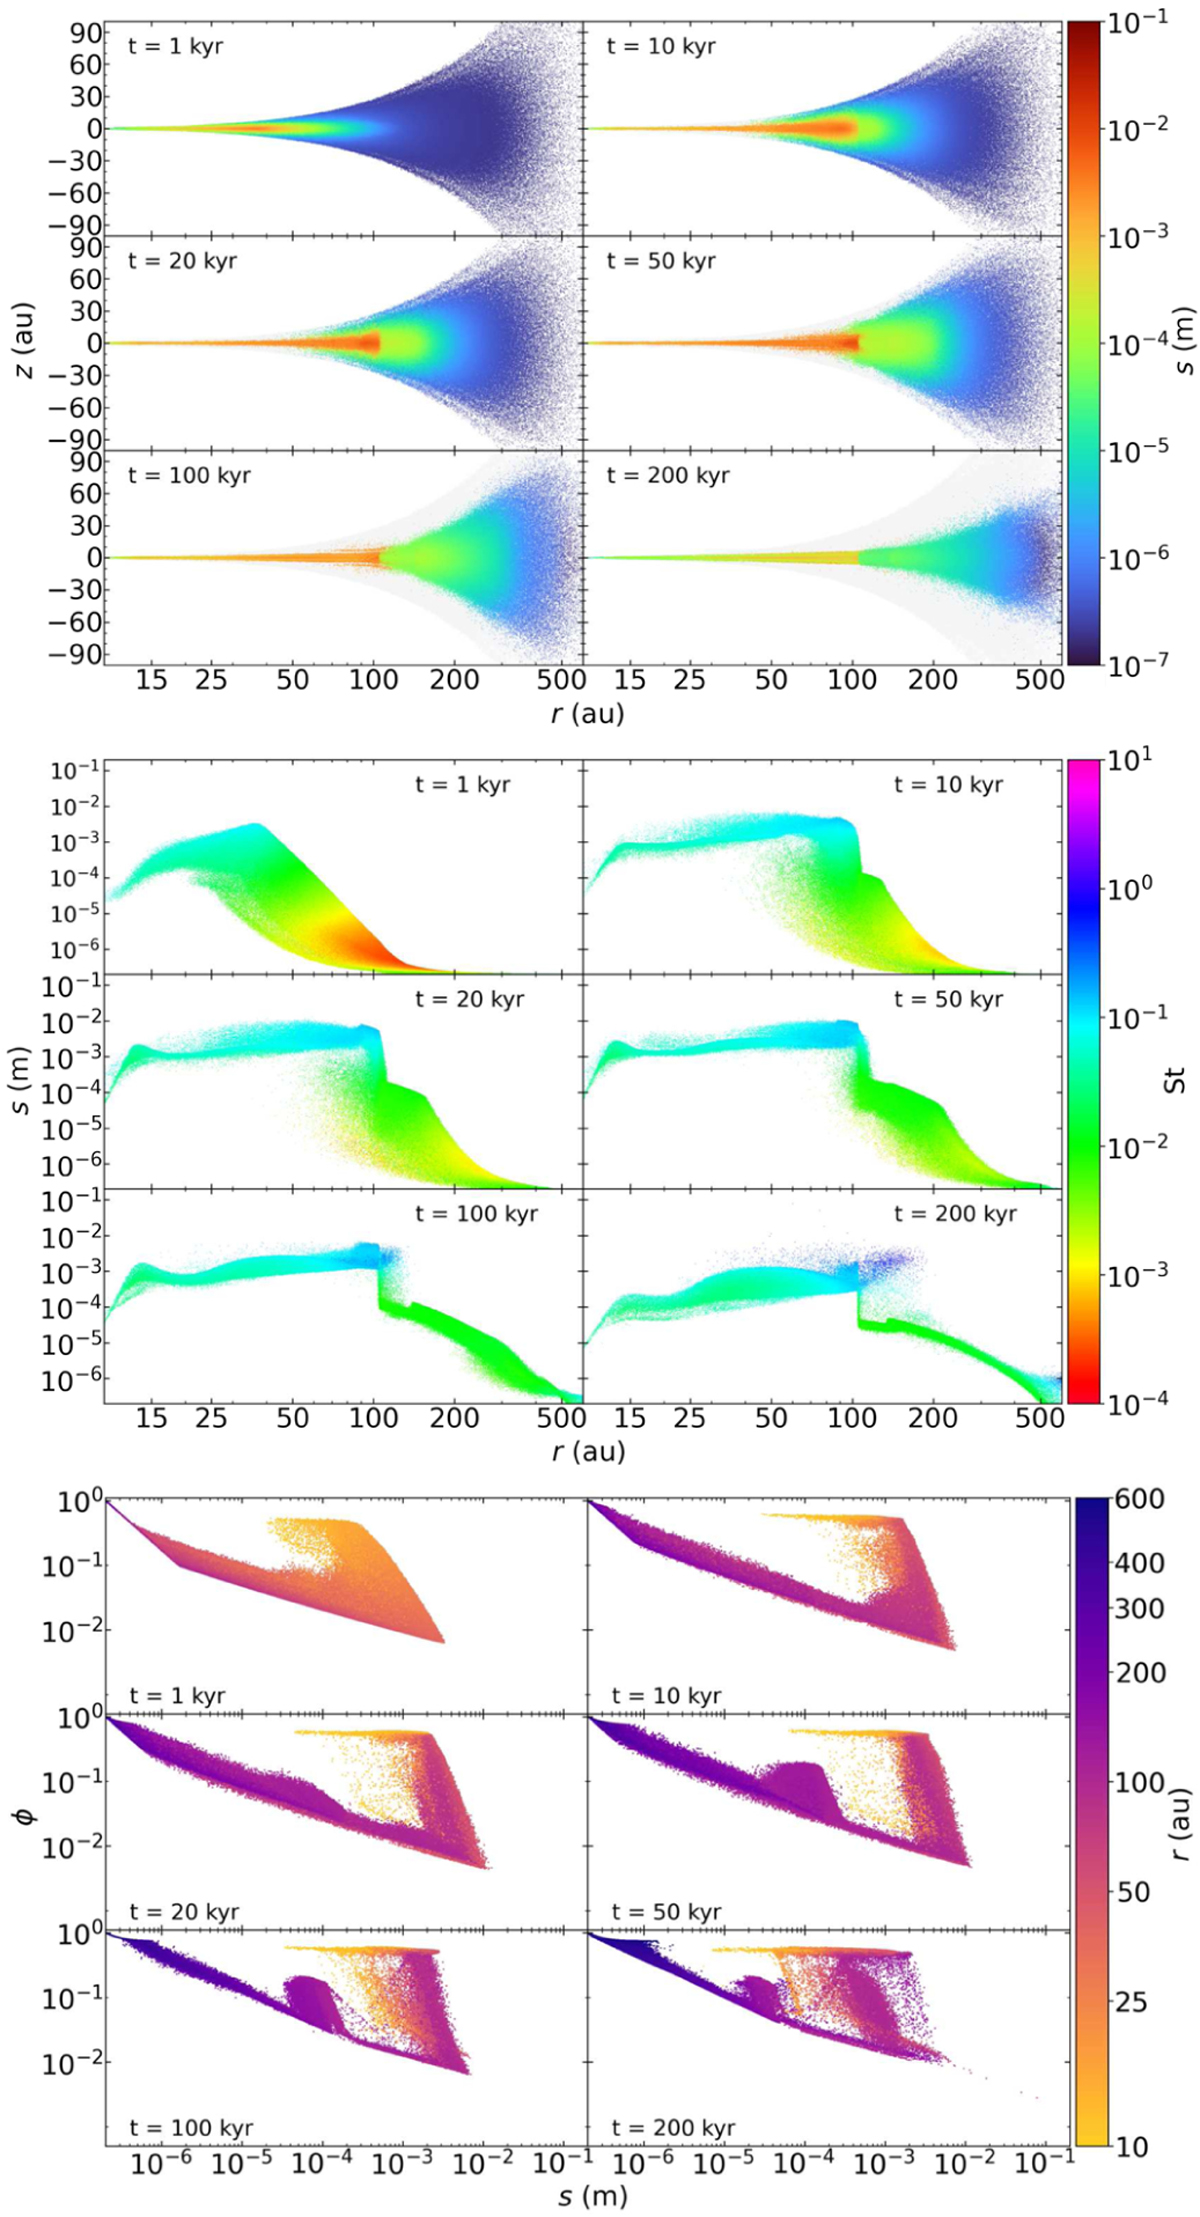
PHANTOM GBFcS-Si-a02-Vf205 simulation. Top: aggregate sizes in the same plane (r, ɀ). Middle: radial grain size distribution, with colour representing the Stokes number St. Bottom: filling factor ϕ plotted against grain size s, with colour indicating the distance r.
Current usage metrics show cumulative count of Article Views (full-text article views including HTML views, PDF and ePub downloads, according to the available data) and Abstracts Views on Vision4Press platform.
Data correspond to usage on the plateform after 2015. The current usage metrics is available 48-96 hours after online publication and is updated daily on week days.
Initial download of the metrics may take a while.