Fig. 9.
Download original image
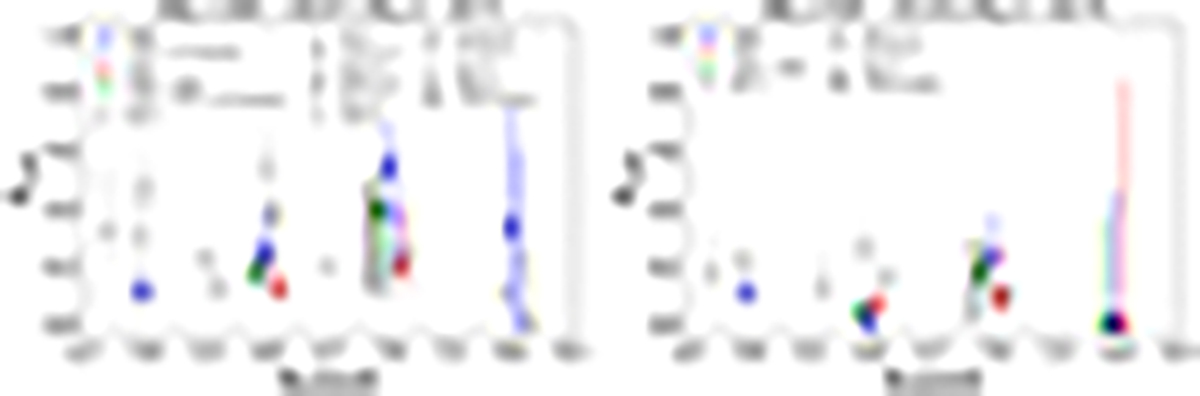
Lyα fraction as a function of redshift. Blue, red, and green data points represent CEERS, JADES, and the combined sample. The open data points are obtained when we do not consider the galaxies in the overdensity at z ∼ 7.18 and z ∼ 7.49. Error bars are calculated from the binomial statistics described in Gehrels (1986). The black bar is the result obtained with the CodaII simulation at z = 7. Grey symbols are taken from literature, we provide the full list here in the same order as the legend: Stark et al. (2011), Tilvi et al. (2014), De Barros et al. (2017), Mason et al. (2018b, 2019), Pentericci et al. (2018a), Fuller et al. (2020), Kusakabe et al. (2020), Goovaerts et al. (2023), Jones et al. (2024), and Nakane et al. (2024). Some of the points have been slightly shifted in redshift for an easier visualization.
Current usage metrics show cumulative count of Article Views (full-text article views including HTML views, PDF and ePub downloads, according to the available data) and Abstracts Views on Vision4Press platform.
Data correspond to usage on the plateform after 2015. The current usage metrics is available 48-96 hours after online publication and is updated daily on week days.
Initial download of the metrics may take a while.