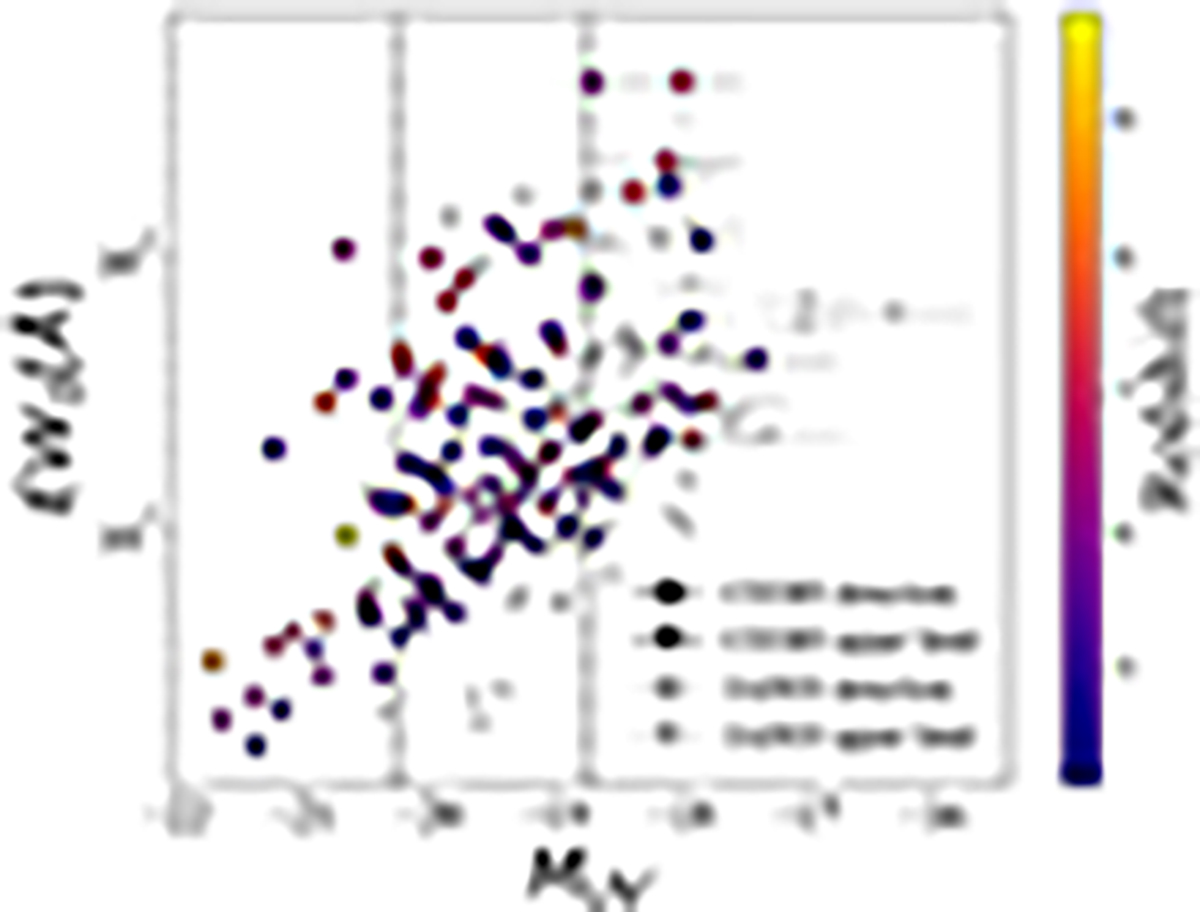
Fig. 6.
Download original image
Lyα EW0 versus MUV for our sample. Circles denote measured EW0 with S/N > 3, while triangles represent galaxies with just EW0, lim upper limits. CEERS data are color coded by redshift, while JADES galaxies are reported in grey for comparison. The black dashed lines (MUV = −20.25 and −18.75) divide the sample from the bright and faint ends.
Current usage metrics show cumulative count of Article Views (full-text article views including HTML views, PDF and ePub downloads, according to the available data) and Abstracts Views on Vision4Press platform.
Data correspond to usage on the plateform after 2015. The current usage metrics is available 48-96 hours after online publication and is updated daily on week days.
Initial download of the metrics may take a while.