Fig. 4.
Download original image
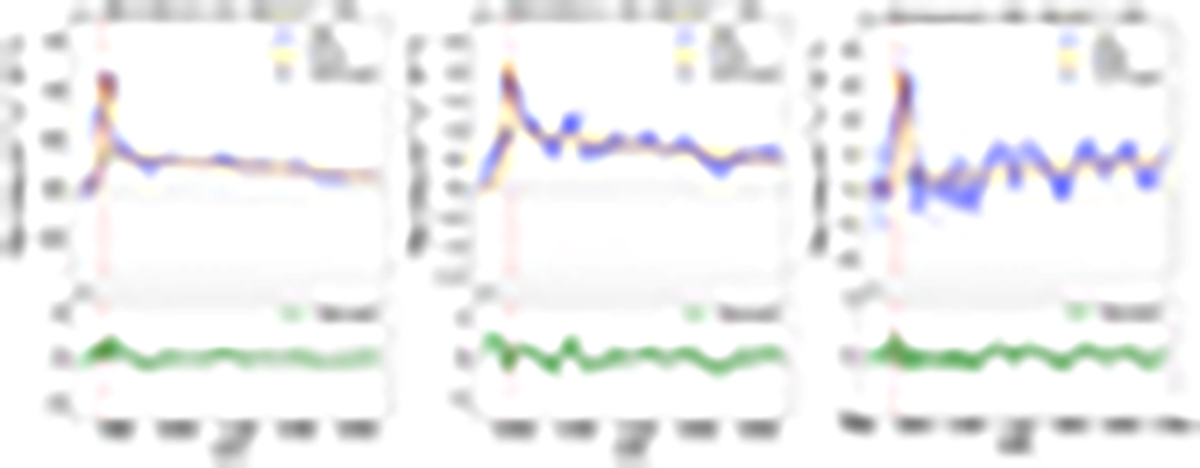
Several examples of fitted Lyα emitters in the sample for different values of the emission line S/N. Left: MSA ID = 1561 with S/N = 23; Center: MSA ID = 439 with S/N = 7; Right: MSA ID = 1142 S/N = 3. In the upper panels, the blue solid line and shaded area denote the flux and error measurement as a function of the observed wavelength. The best fit-model is represented by an orange solid line, with the related ![]() reported at the top of each panel. The fitted continuum value at the Lyα line peak is represented by the star symbol. The vertical red line indicates the Lyα expected wavelength at the systemic redshift of the source. The lower panels show the residuals from the fit. In the appendix (Appendix A) we present the rest of the Lyα emitting galaxies.
reported at the top of each panel. The fitted continuum value at the Lyα line peak is represented by the star symbol. The vertical red line indicates the Lyα expected wavelength at the systemic redshift of the source. The lower panels show the residuals from the fit. In the appendix (Appendix A) we present the rest of the Lyα emitting galaxies.
Current usage metrics show cumulative count of Article Views (full-text article views including HTML views, PDF and ePub downloads, according to the available data) and Abstracts Views on Vision4Press platform.
Data correspond to usage on the plateform after 2015. The current usage metrics is available 48-96 hours after online publication and is updated daily on week days.
Initial download of the metrics may take a while.