Fig. 10.
Download original image
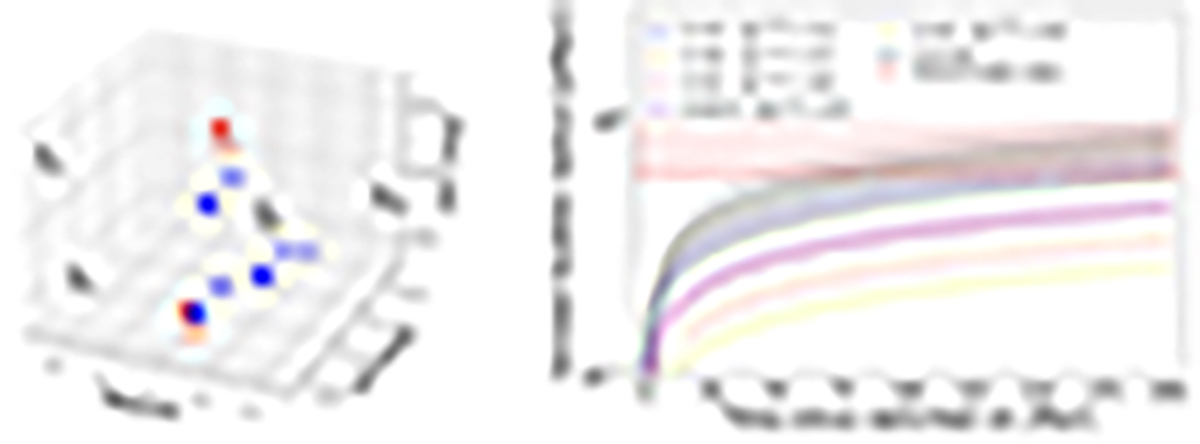
Ionized bubble at z = 7.18. Left: position of the five spectroscopically-confirmed galaxies in the z ∼ 7.18 reionized region. Blue stars are the three LAEs with S/N > 3 and the red stars are the non-emitting ones, while we show the four photometric candidates with grey circles. Right: predicted size of an ionized bubble as a function of time since ionizing radiation is switched on. Solid coloured lines are for individual sources while the black solid line and shaded region represent the predicted size of the ionized bubble carved by the 5 galaxies together. The horizontal dashed line represents the physical bubble radius.
Current usage metrics show cumulative count of Article Views (full-text article views including HTML views, PDF and ePub downloads, according to the available data) and Abstracts Views on Vision4Press platform.
Data correspond to usage on the plateform after 2015. The current usage metrics is available 48-96 hours after online publication and is updated daily on week days.
Initial download of the metrics may take a while.