Open Access
Fig. 3.
Download original image
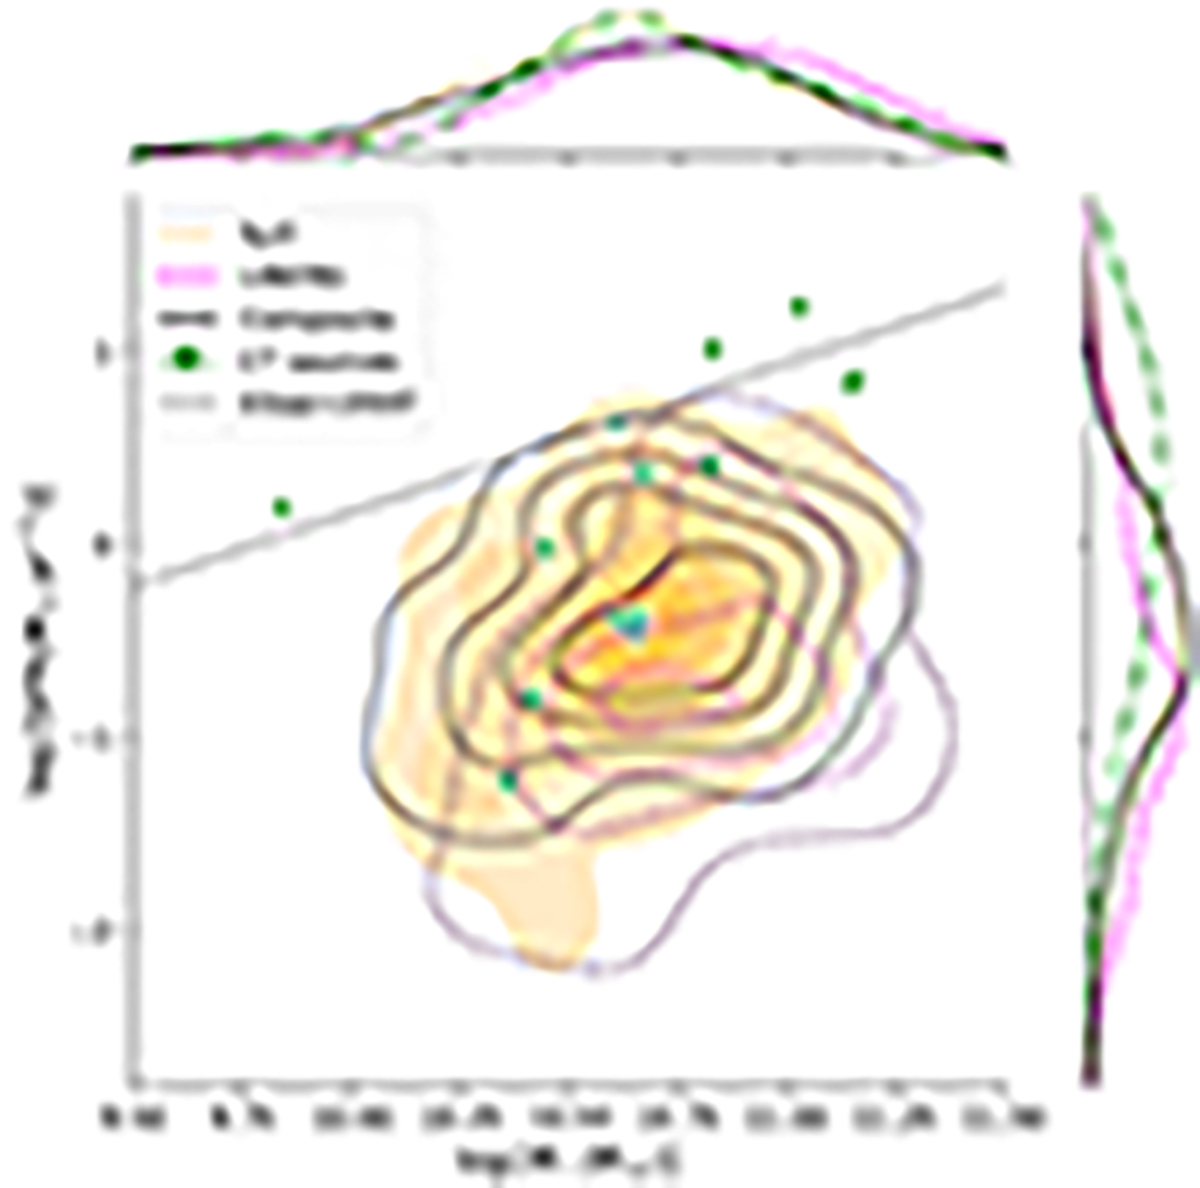
Distribution of sources in the SFR–M* plane. Different AGN populations are presented with different colors and lines, as indicated in the legend of the plot. The solid gray line shows the local SFR–M* relation presented in Elbaz et al. (2007) for SDSS galaxies.
Current usage metrics show cumulative count of Article Views (full-text article views including HTML views, PDF and ePub downloads, according to the available data) and Abstracts Views on Vision4Press platform.
Data correspond to usage on the plateform after 2015. The current usage metrics is available 48-96 hours after online publication and is updated daily on week days.
Initial download of the metrics may take a while.