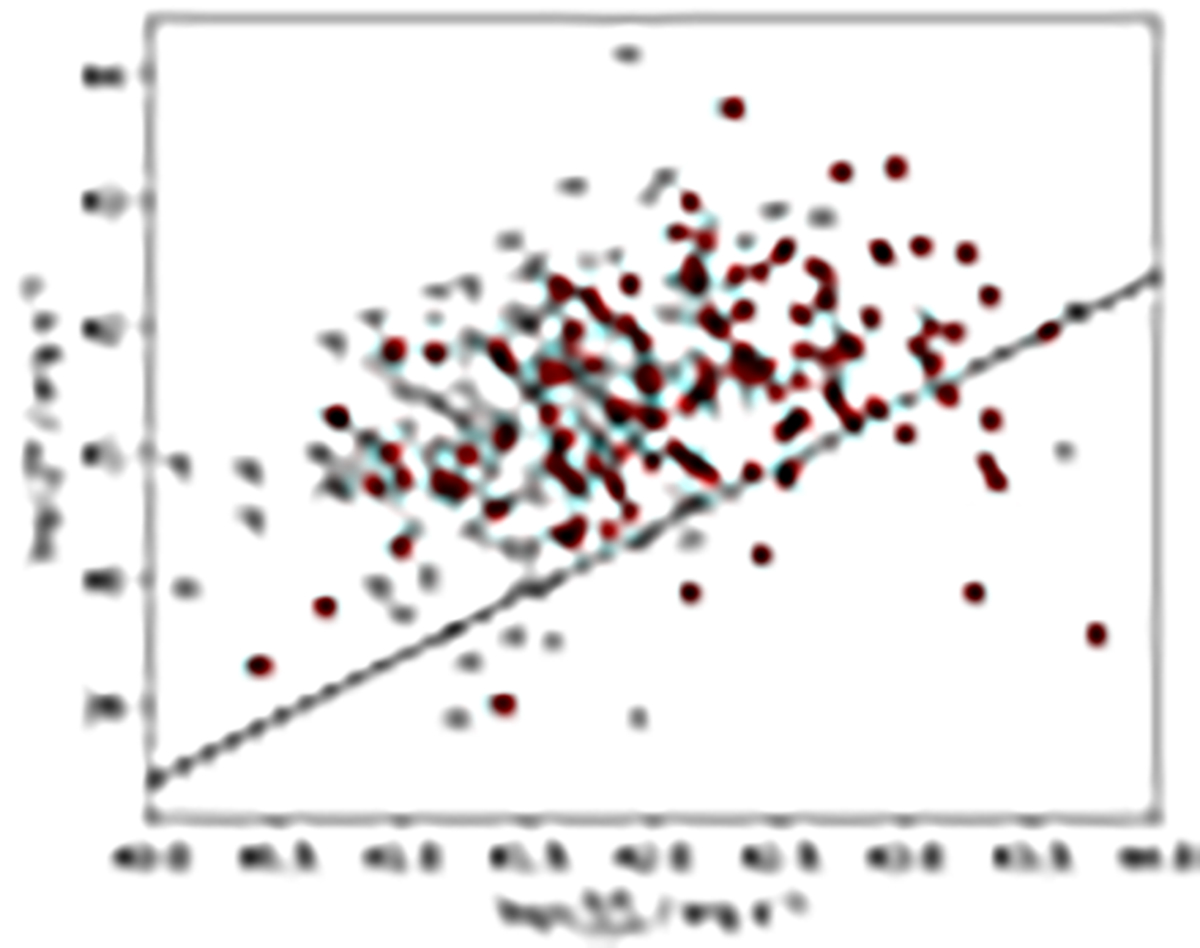
Fig. 2.
Download original image
AGN luminosity at 12 μm as estimated by CIGALE versus observed X-ray luminosity in the 2–10 keV band for our sample of local SDSS AGN. Gray circles correspond to LINER+Composite objects, and red circles are Seyfert 2 galaxies. Symbols marked with a horizontal and/or vertical bar show upper limits in the 12 μm and/or X-ray luminosity, respectively. The black, dashed line shows ![]() .
.
Current usage metrics show cumulative count of Article Views (full-text article views including HTML views, PDF and ePub downloads, according to the available data) and Abstracts Views on Vision4Press platform.
Data correspond to usage on the plateform after 2015. The current usage metrics is available 48-96 hours after online publication and is updated daily on week days.
Initial download of the metrics may take a while.