Fig. 8

Download original image
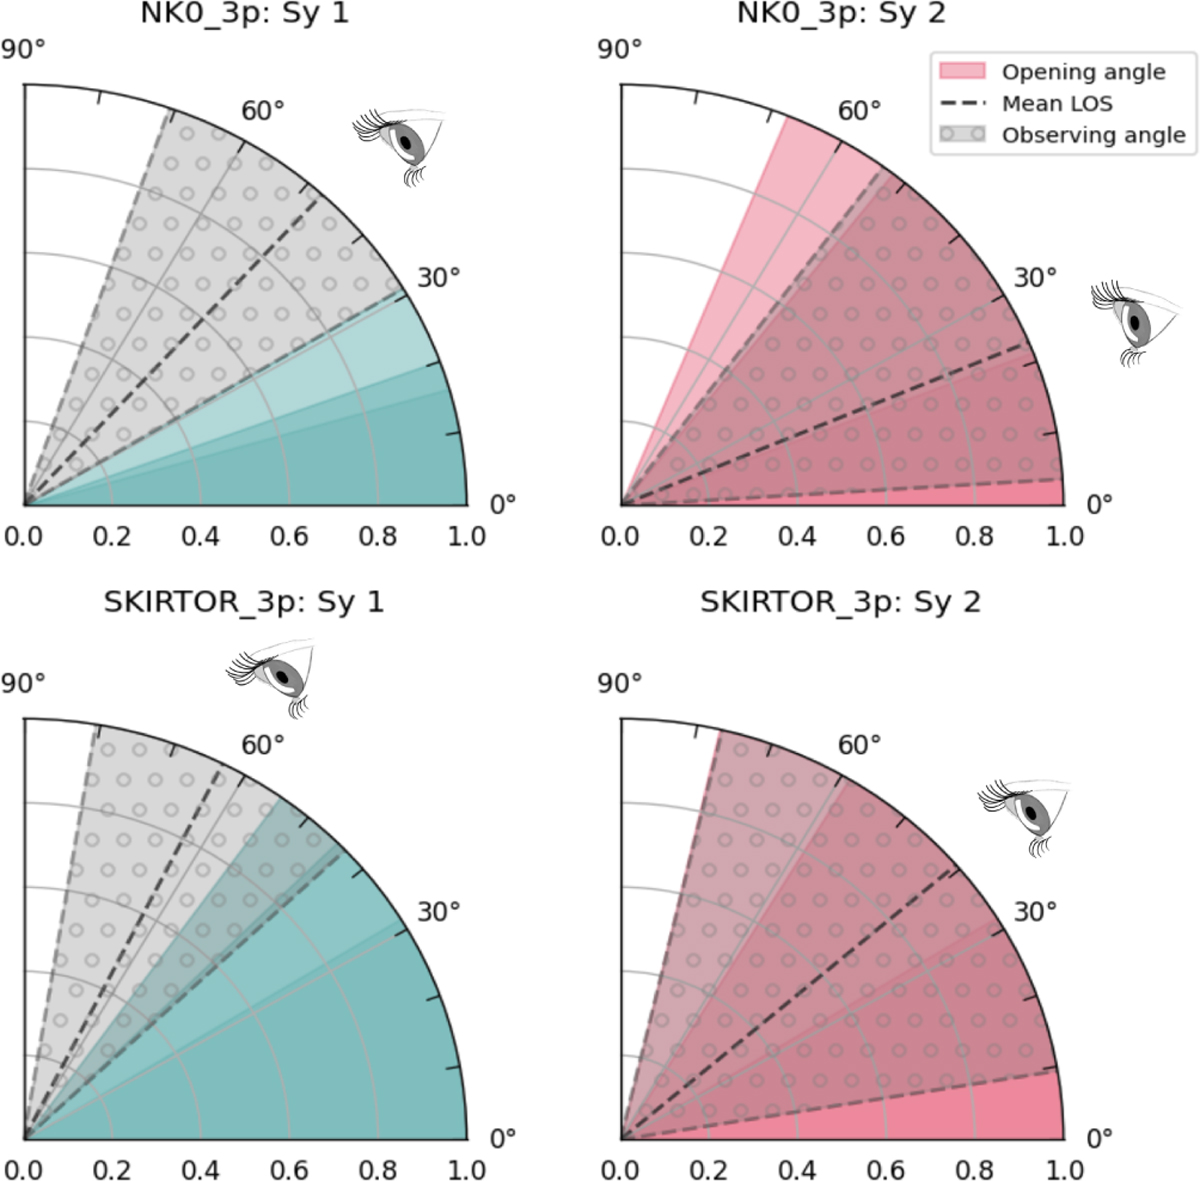
Representation of the upper right quadrant of the cross-section of the toroidal distribution of hot nuclear dust in NK08 (upper panels) and SKIRTOR (lower panels) models. The shaded color areas with decreasing transparency represent the 16th, 50th and 84th percentiles of the torus opening angle in Seyfert 1 (blue) and Seyfert 2 (magenta) AGNs. While the black dotted lines represent the median values of the viewing angle and the dotted gray shaded areas are the 16th and 84th percentiles.
Current usage metrics show cumulative count of Article Views (full-text article views including HTML views, PDF and ePub downloads, according to the available data) and Abstracts Views on Vision4Press platform.
Data correspond to usage on the plateform after 2015. The current usage metrics is available 48-96 hours after online publication and is updated daily on week days.
Initial download of the metrics may take a while.


