Fig. 5
Download original image
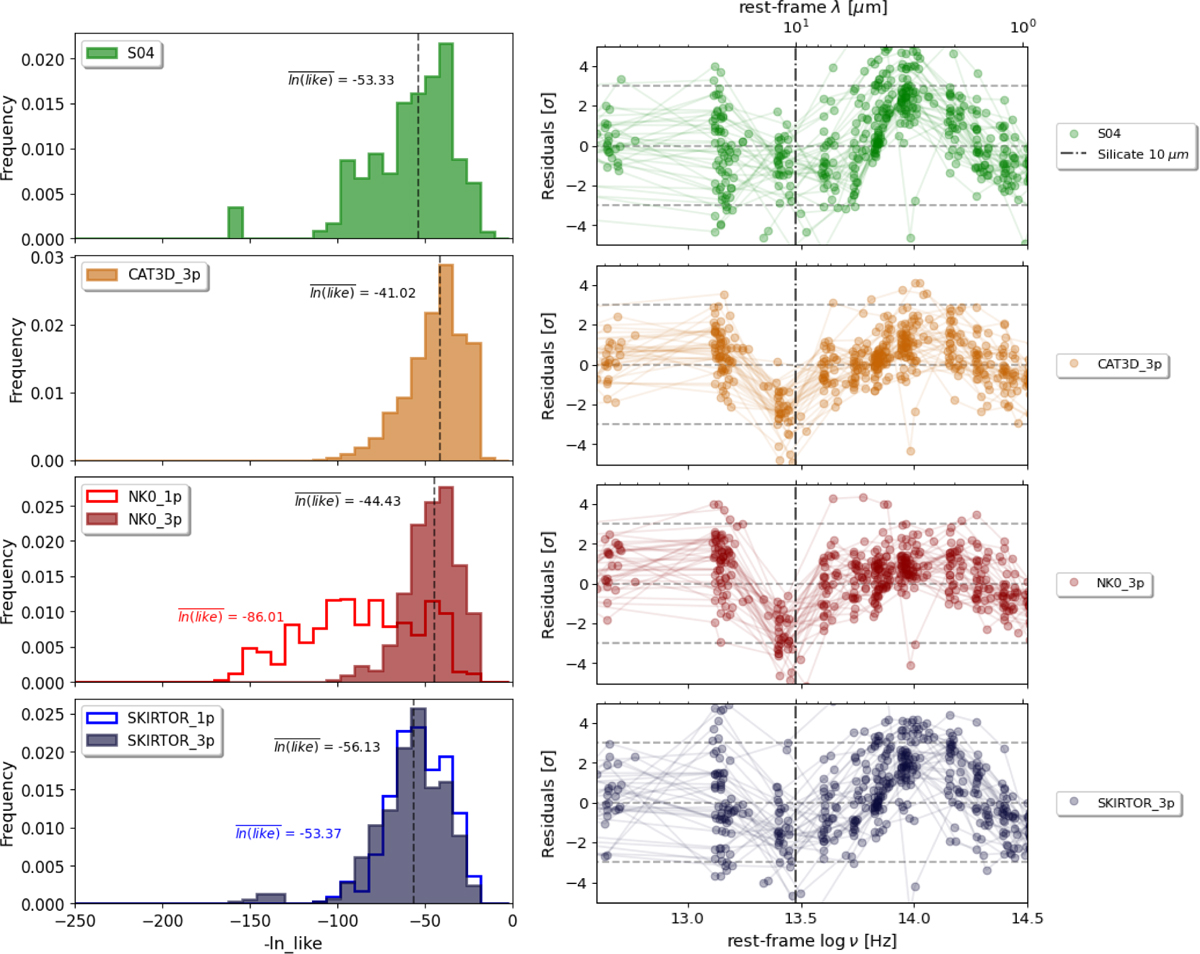
Performance analysis of different torus models in SED fitting: The models presented are the homogeneous S04 (upper panel), the clumpy and windy CAT3D (central upper panel), the clumpy NK08 (central lower panel), and the two-phase SKIRTOR model (lower panel). The left panel shows the histograms of the logarithm of the likelihood values corresponding to each model and the dashed line in each plot indicates the median value of the distribution. Residuals from the best fits for each galaxy of the sample are shown in the right panel. The plot shows the existence of templates that manage to capture some SED features (high density of points around zero) while systematically failing in modeling specific regions of the observed SED (high dispersion). The dash-dotted line indicates the 10 μm feature and the dashed lines show the limits of 0σ, 3σ, and −3σ.
Current usage metrics show cumulative count of Article Views (full-text article views including HTML views, PDF and ePub downloads, according to the available data) and Abstracts Views on Vision4Press platform.
Data correspond to usage on the plateform after 2015. The current usage metrics is available 48-96 hours after online publication and is updated daily on week days.
Initial download of the metrics may take a while.