Fig. 10
Download original image
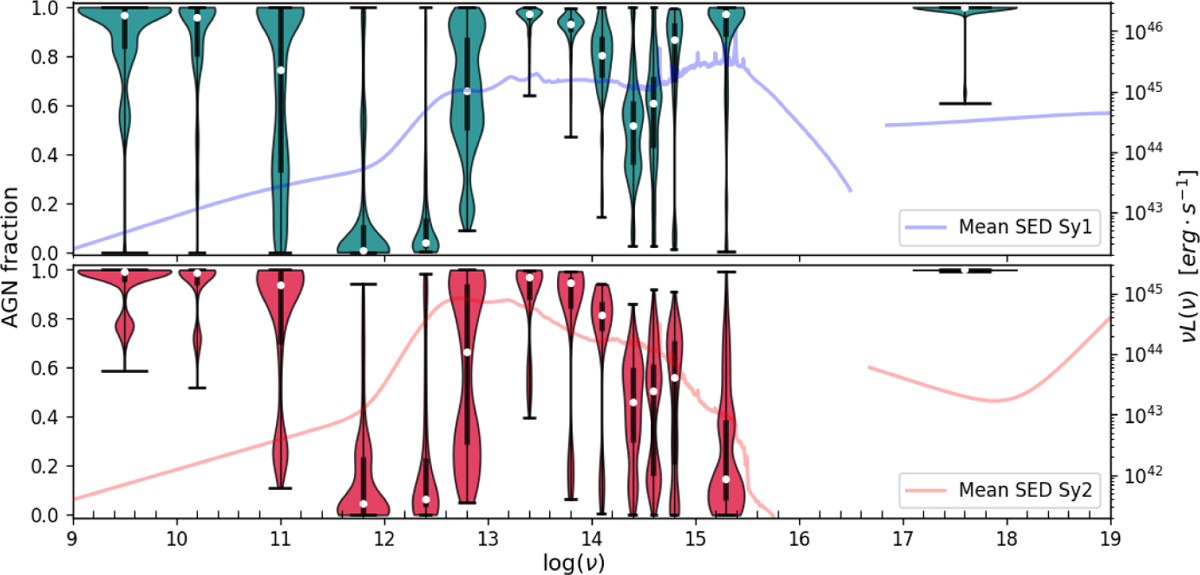
AGN fraction distribution as a function of frequency for Sy1 (upper panel) and Sy2 (lower panel) populations. The white dots within the violin plots highlight the median of the distribution while the black line is the range between the 25th and 75th percentiles. The blue and red curves present the average radio-to-X-ray SED, including BC03_metal, S17, CAT3D, THB21, and combinations of SPL and DPL radio models, for type 1 and type 2 AGNs, respectively.
Current usage metrics show cumulative count of Article Views (full-text article views including HTML views, PDF and ePub downloads, according to the available data) and Abstracts Views on Vision4Press platform.
Data correspond to usage on the plateform after 2015. The current usage metrics is available 48-96 hours after online publication and is updated daily on week days.
Initial download of the metrics may take a while.