Open Access
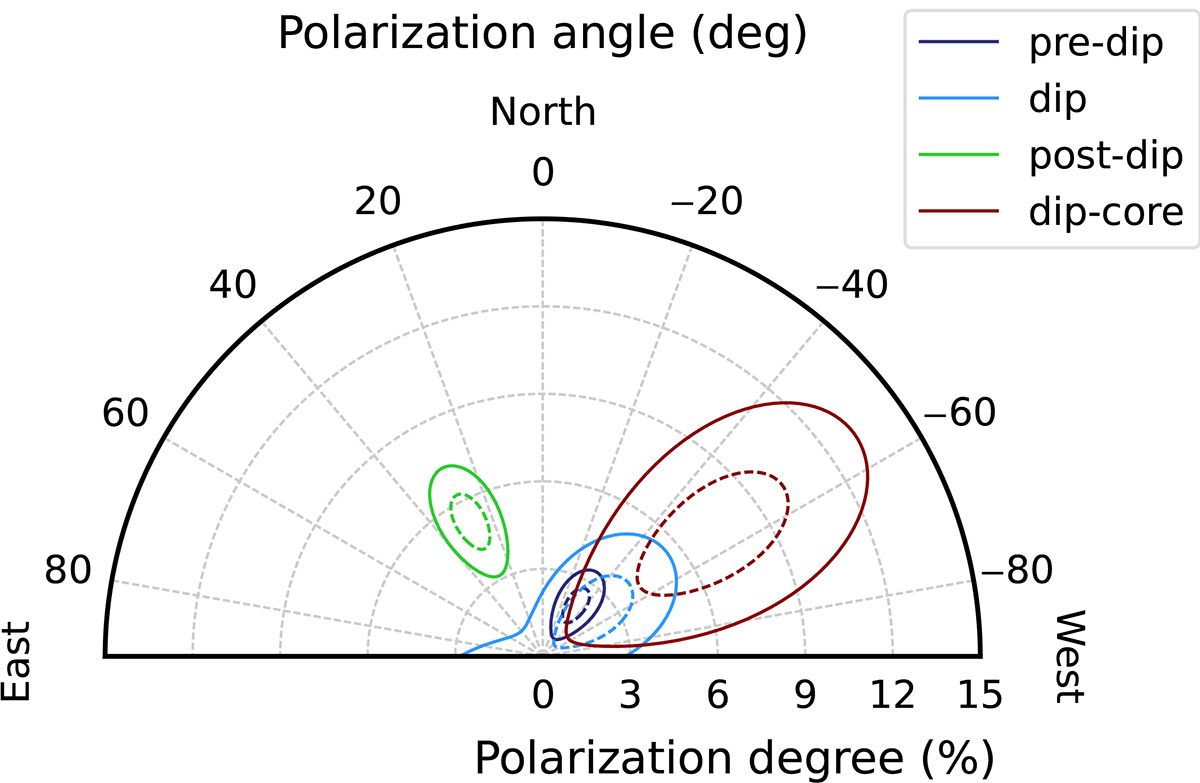
Fig. 4.
Download original image
Polar plot of the PD and PA in the 2–8 keV energy band for the three parts of the observation (pre-dip, dip, and post-dip) and the dip core. Contours are at the 68% CL (dashed lines) and 99% CL (solid lines).
Current usage metrics show cumulative count of Article Views (full-text article views including HTML views, PDF and ePub downloads, according to the available data) and Abstracts Views on Vision4Press platform.
Data correspond to usage on the plateform after 2015. The current usage metrics is available 48-96 hours after online publication and is updated daily on week days.
Initial download of the metrics may take a while.