Fig. 11.
Download original image
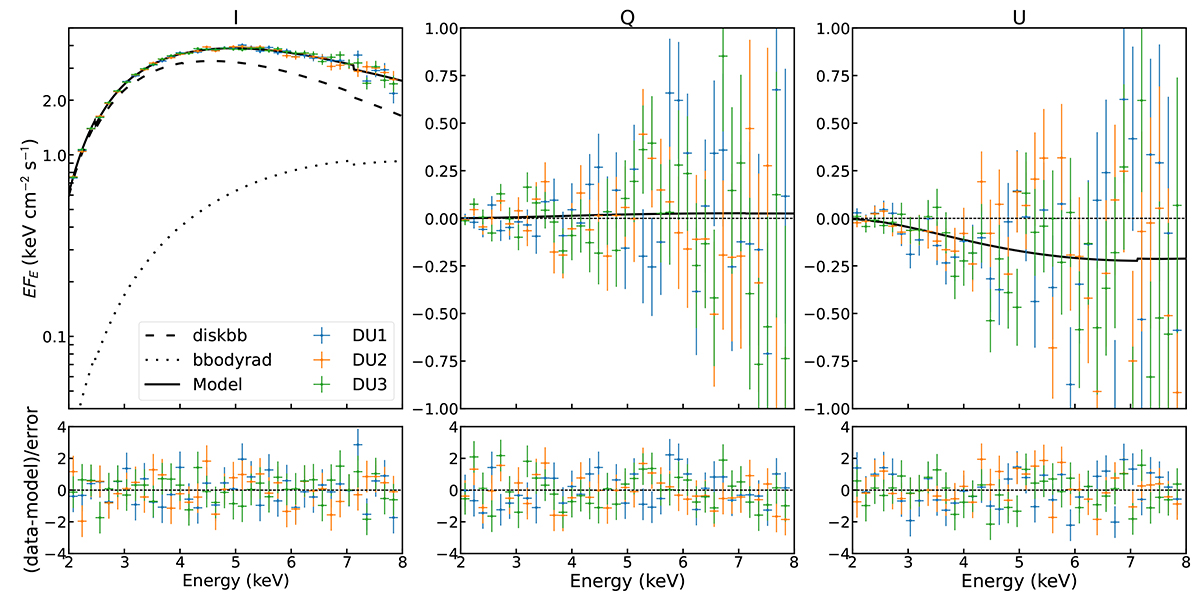
Spectral energy distribution of GX 13+1 in EFE representation as observed by IXPE in bin 1. The left, middle, and right panels show the Stokes parameters I, Q, and U, respectively. The fit is performed in the 2–8 keV energy band using the three IXPE detectors and applying the model tbabs*pollin*(diskbb+bbodyrad). The total model is shown with the solid black line, and diskbb and bbodyrad are shown with the dashed and dotted lines, respectively. The lower subpanels show the residuals between the data and the best fit. The data are rebinned only for plotting purposes.
Current usage metrics show cumulative count of Article Views (full-text article views including HTML views, PDF and ePub downloads, according to the available data) and Abstracts Views on Vision4Press platform.
Data correspond to usage on the plateform after 2015. The current usage metrics is available 48-96 hours after online publication and is updated daily on week days.
Initial download of the metrics may take a while.