Fig. 2
Download original image
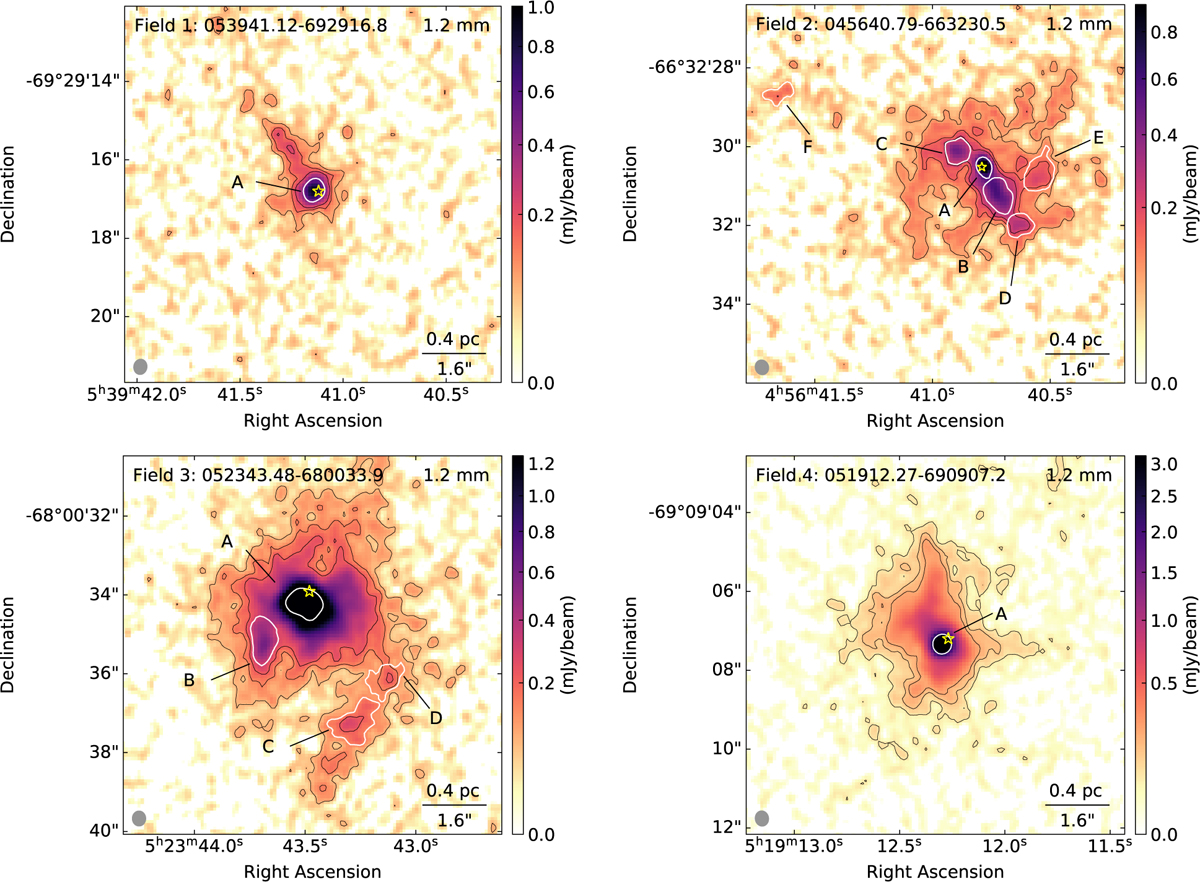
Examples of the 1.2 mm continuum emission toward four regions of the LMC sample. The contours show the three, six, and nine times the σrms. The identified compact cores are highlighted with white contours at 50% of the peak emission. The synthesized beam of the images and a scale bar are shown in the bottom-left and bottom-right corners of each panel, respectively. See Paper II for more details on the 20 fields observed across the LMC (see Table 1).
Current usage metrics show cumulative count of Article Views (full-text article views including HTML views, PDF and ePub downloads, according to the available data) and Abstracts Views on Vision4Press platform.
Data correspond to usage on the plateform after 2015. The current usage metrics is available 48-96 hours after online publication and is updated daily on week days.
Initial download of the metrics may take a while.