Fig. 16
Download original image
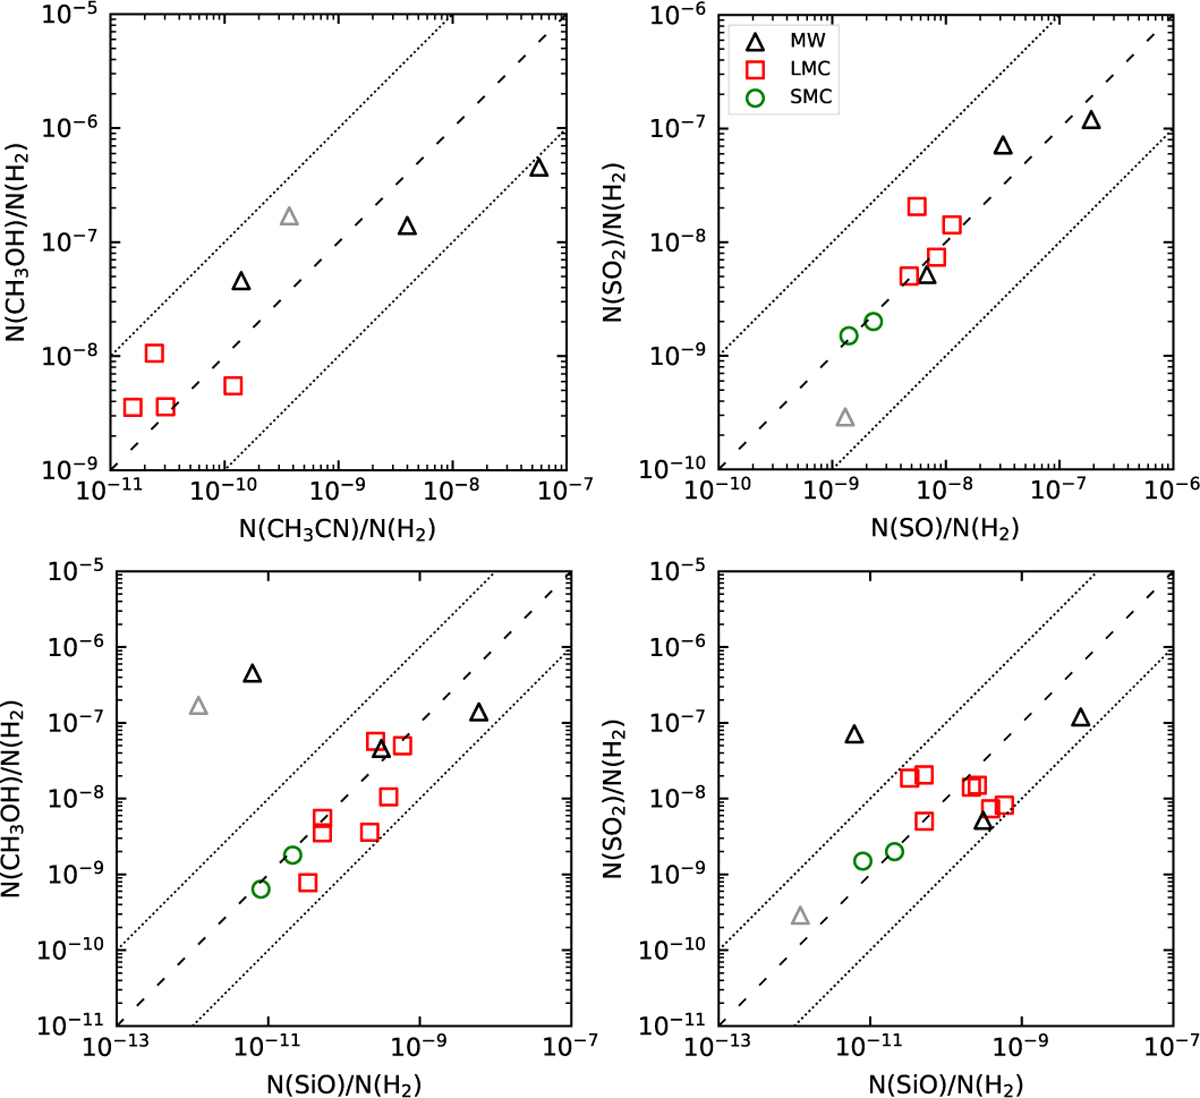
Comparisons of the abundances of CH3OH and CH3CN and SO2 and SO for the hot cores in the SMC (open green circles), LMC (red rectangles), and MW (black triangles for inner Galactic hot cores and gray triangle for outer Galactic hot core). Dashed lines show abundance relations of 1:1 for the top-right panel and 1:100 for the other panels. The dotted lines show a variation of a factor of ten above and below the relations described by the dashed lines.
Current usage metrics show cumulative count of Article Views (full-text article views including HTML views, PDF and ePub downloads, according to the available data) and Abstracts Views on Vision4Press platform.
Data correspond to usage on the plateform after 2015. The current usage metrics is available 48-96 hours after online publication and is updated daily on week days.
Initial download of the metrics may take a while.