Fig. 14
Download original image
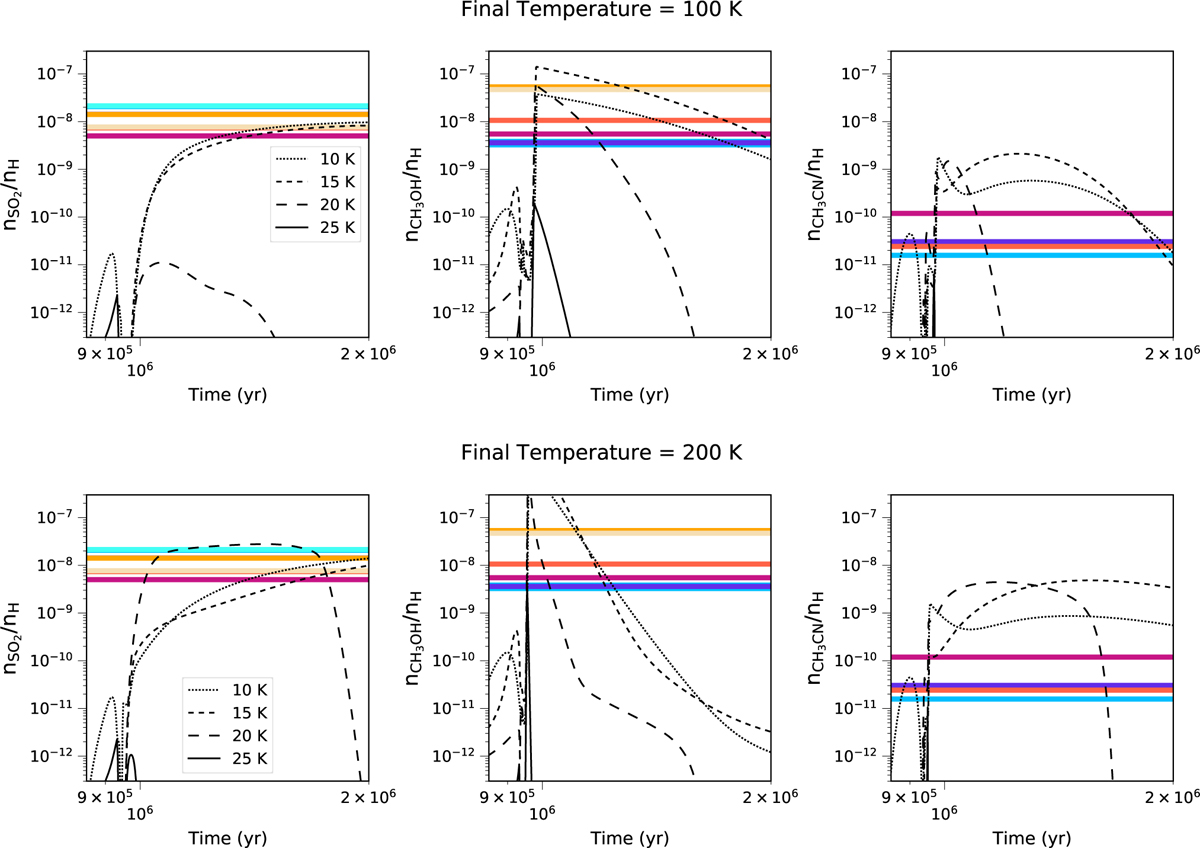
Comparisons of abundances for SO2, CH3OH, and CH3CN from observations of the seven hot cores detected in this galaxy and the LMC hot core models for the final hot core temperature of 100 K (top) and 200 K (bottom). The black curves show abundances over time for an initial dust temperature of 10 (dotted curve), 15 (dashed curve), 20 (larger dashed curve), and 25 K (the solid curve). The horizontal colored line shows the single abundance value for each hot core and follows the same color code as Fig. 13 (see the text for more details).
Current usage metrics show cumulative count of Article Views (full-text article views including HTML views, PDF and ePub downloads, according to the available data) and Abstracts Views on Vision4Press platform.
Data correspond to usage on the plateform after 2015. The current usage metrics is available 48-96 hours after online publication and is updated daily on week days.
Initial download of the metrics may take a while.