Fig. 1
Download original image
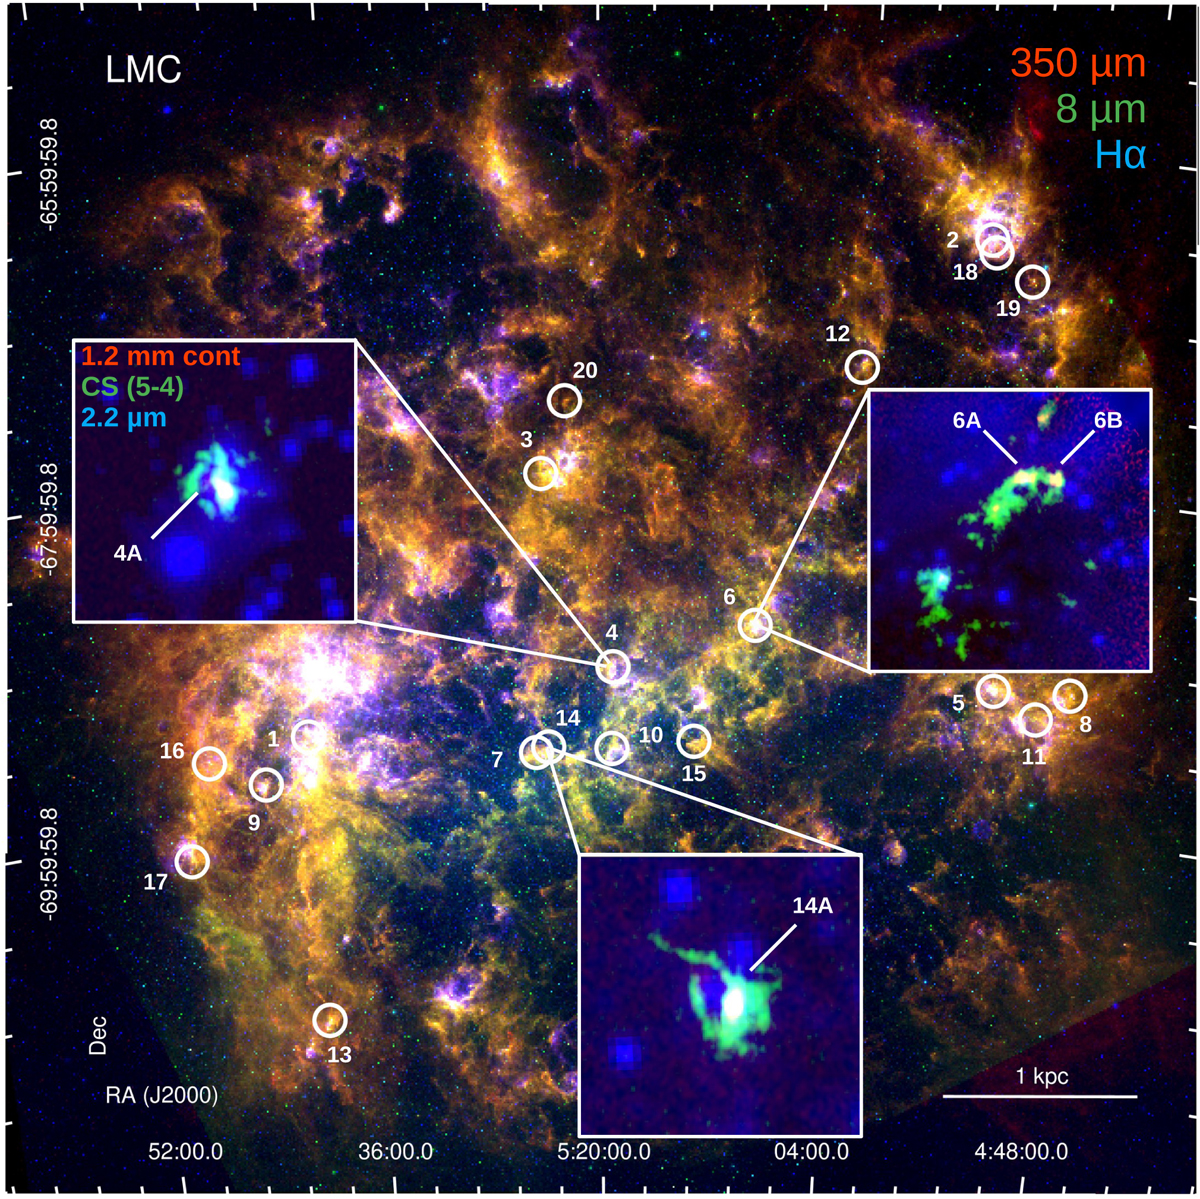
Color-composite image of the LMC combining the Hα (blue, Smith et al. 2000), SAGE/IRAC 8 µm (green, Meixner et al. 2006), and HERITAGE/SPIRE 350 µm (red, Meixner et al. 2013) images. The positions of the 20 ALMA fields are marked with white circles 15 times larger than the field of view of our ALMA observations and the field number. The color-composite images of the fields with hot core detection combining the VMC K-band (blue, Cioni et al. 2011), ALMA CS (5–4) peak intensity (green, this work), and 1.2 mm ALMA continuum (red, this work and Paper II) images are shown as insets. The hot cores reported in this paper, 4A (ST16; Shimonishi et al. 2020), 6A (N105-2 B; Sewiło et al. 2022), 6B (N105-2 A; Sewiło et al. 2022), and 14A are highlighted in the insets images.
Current usage metrics show cumulative count of Article Views (full-text article views including HTML views, PDF and ePub downloads, according to the available data) and Abstracts Views on Vision4Press platform.
Data correspond to usage on the plateform after 2015. The current usage metrics is available 48-96 hours after online publication and is updated daily on week days.
Initial download of the metrics may take a while.