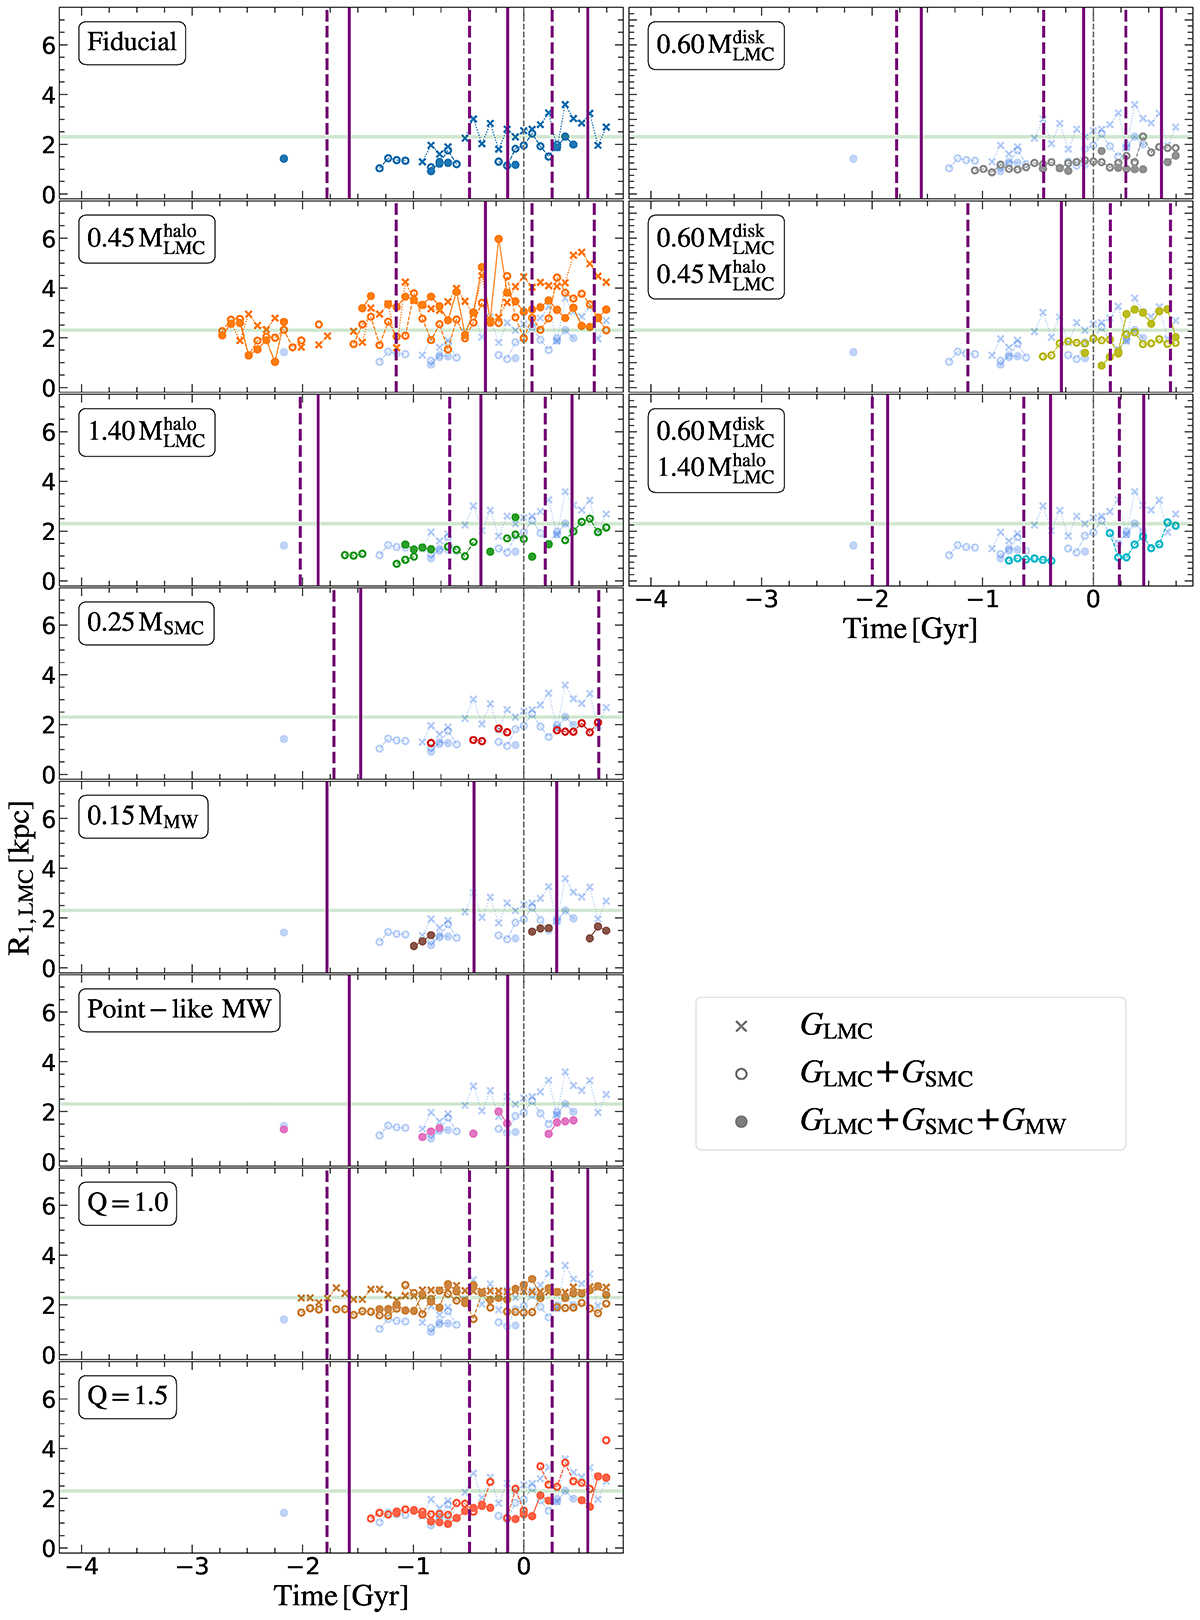
Fig. 8.
Download original image
Evolution of the GLMC bar length given by the outer bar radius R1 from the Dehnen method. The cross corresponds to the isolated GLMC model, whereas the empty and filled dots show the GLMC + GSMC and GLMC + GSMC + GMW models, respectively. The different panels represent different sets of simulations. The vertical purple solid (dashed) lines correspond to the pericentres of the MCs of the GLMC + GSMC + GMW (GLMC + GSMC) models. The vertical grey dashed line corresponds to the present time t = 0. The horizontal green area corresponds to the LMC bar length measured in Jiménez-Arranz et al. (2024), R1, LMC = 2.3 kpc. For the sake of comparison, the evolution of the GLMC bar length for the models of the fiducial set is plotted in shadowed blue lines. We only show the obtained value when Σ2/Σ0 > 0.2, which is the threshold used to consider that the GLMC disc has a bar.
Current usage metrics show cumulative count of Article Views (full-text article views including HTML views, PDF and ePub downloads, according to the available data) and Abstracts Views on Vision4Press platform.
Data correspond to usage on the plateform after 2015. The current usage metrics is available 48-96 hours after online publication and is updated daily on week days.
Initial download of the metrics may take a while.