Fig. 7.
Download original image
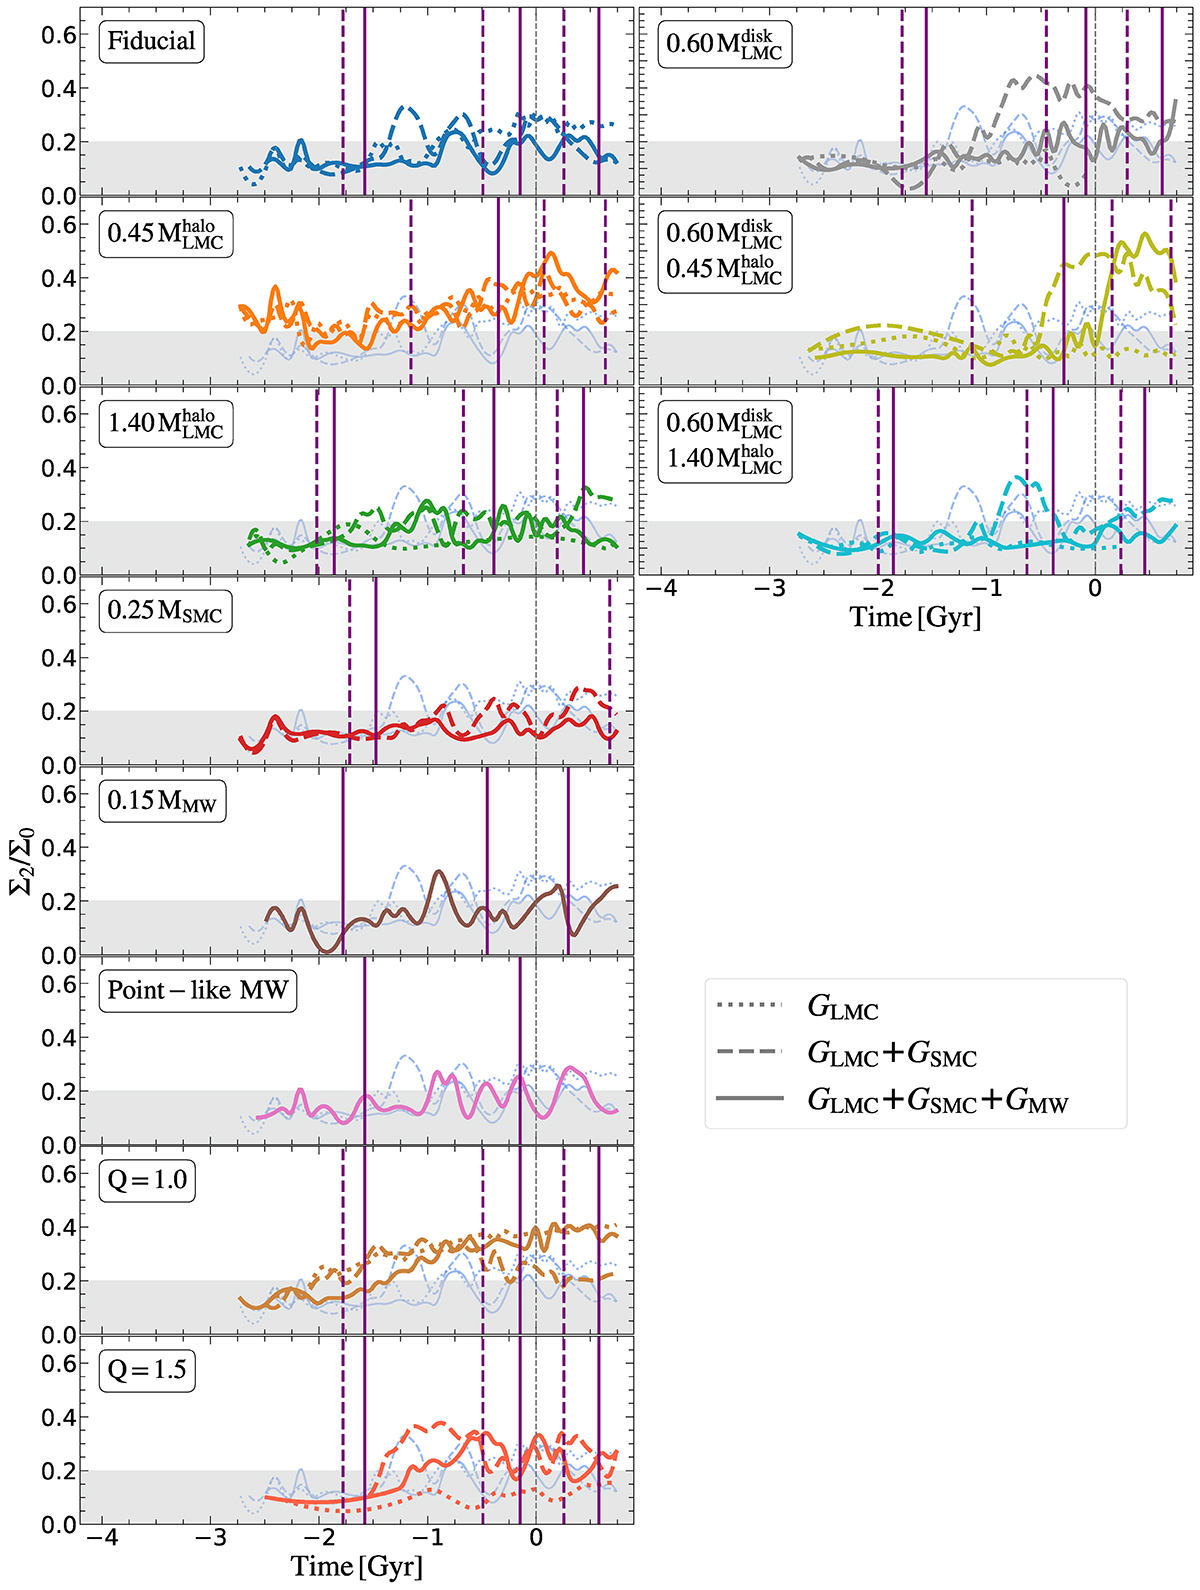
Same as Fig. 6 but for the relative m = 2 Fourier amplitude of the GLMC bar region. The grey area corresponds to Σ2/Σ0 = 0.2, which is the threshold used to consider whether or not the GLMC disc has a bar. The first 1.25 Gyr are not shown because this is when the GLMC disc is being relaxed, which corresponds to two times the disc rotation.
Current usage metrics show cumulative count of Article Views (full-text article views including HTML views, PDF and ePub downloads, according to the available data) and Abstracts Views on Vision4Press platform.
Data correspond to usage on the plateform after 2015. The current usage metrics is available 48-96 hours after online publication and is updated daily on week days.
Initial download of the metrics may take a while.