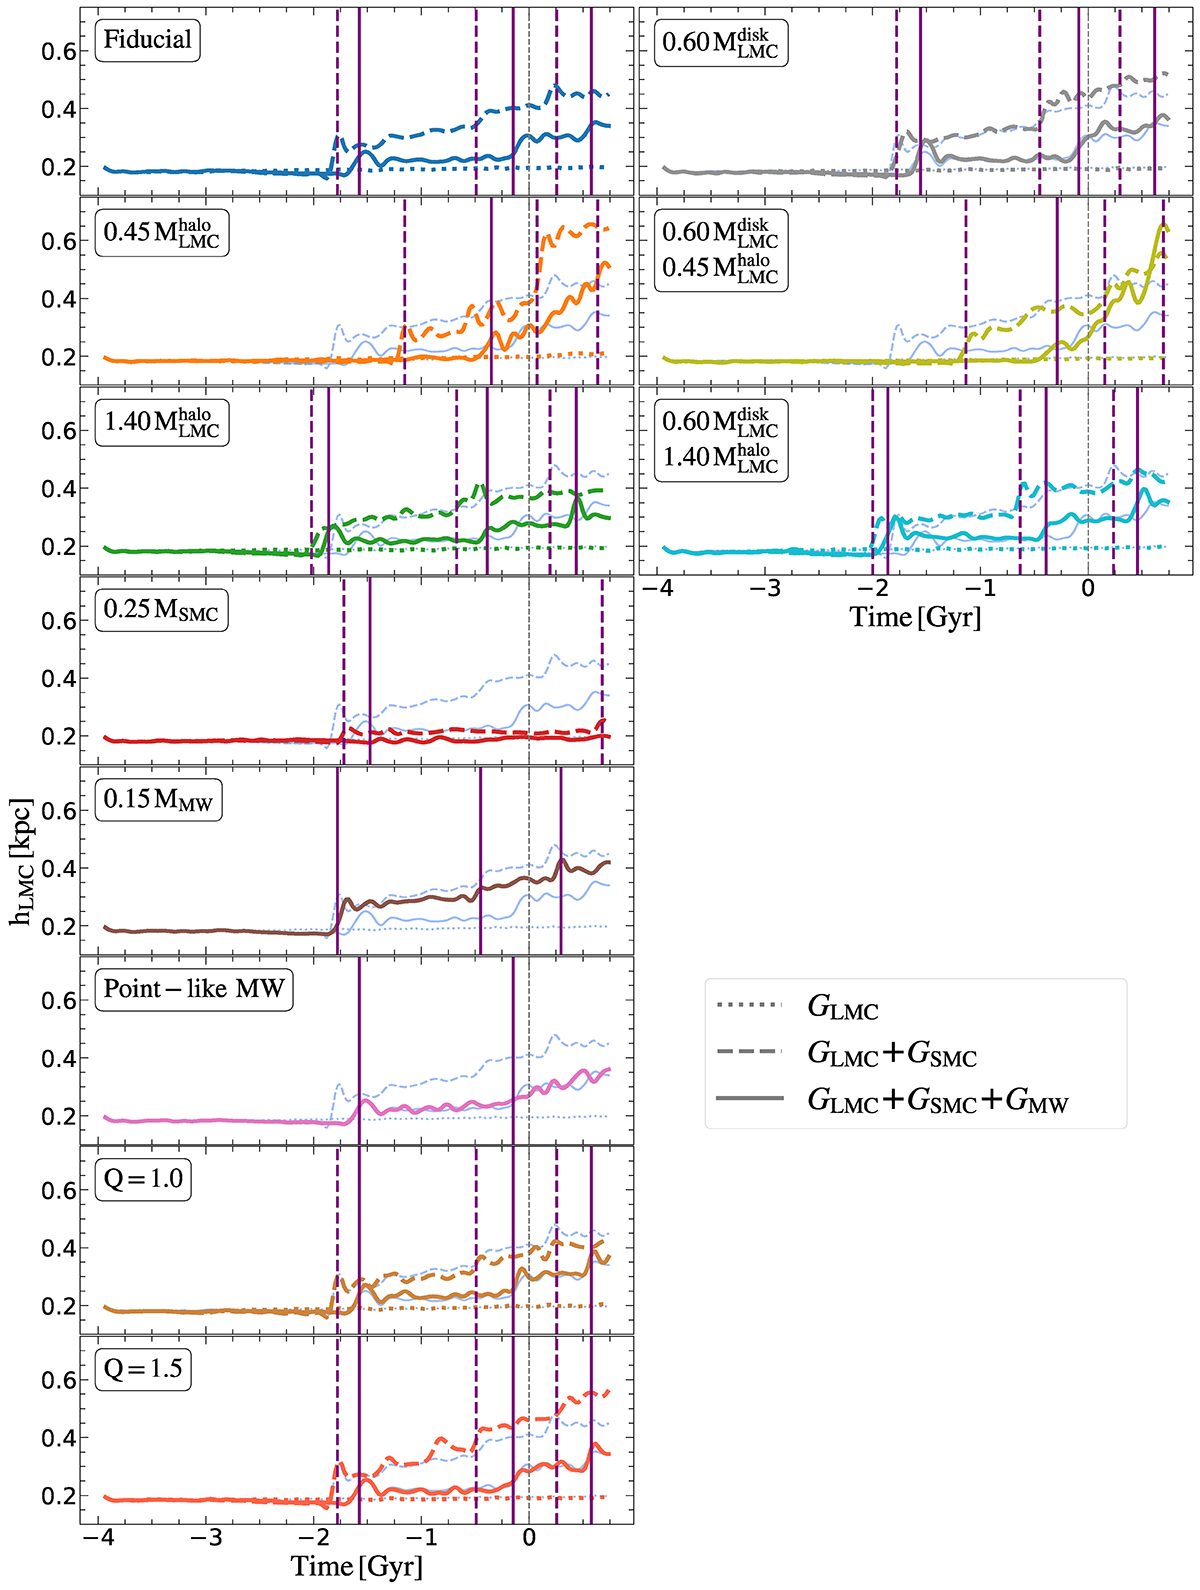
Fig. 6.
Download original image
Evolution of the scale height of the GLMC disc. The dotted, dashed, and solid lines show the GLMC, GLMC + GSMC, and GLMC + GSMC + GMW models, respectively. The different panels represent different sets of simulations. The vertical purple solid (dashed) lines correspond to the GLMC − GSMC pericentres of the GLMC + GSMC + GMW (GLMC + GSMC) models. The vertical grey dashed line corresponds to the present time t = 0. For the sake of comparison, we plot the evolution of the scale height of the GLMC disc for the models of the fiducial set in shadowed blue lines.
Current usage metrics show cumulative count of Article Views (full-text article views including HTML views, PDF and ePub downloads, according to the available data) and Abstracts Views on Vision4Press platform.
Data correspond to usage on the plateform after 2015. The current usage metrics is available 48-96 hours after online publication and is updated daily on week days.
Initial download of the metrics may take a while.