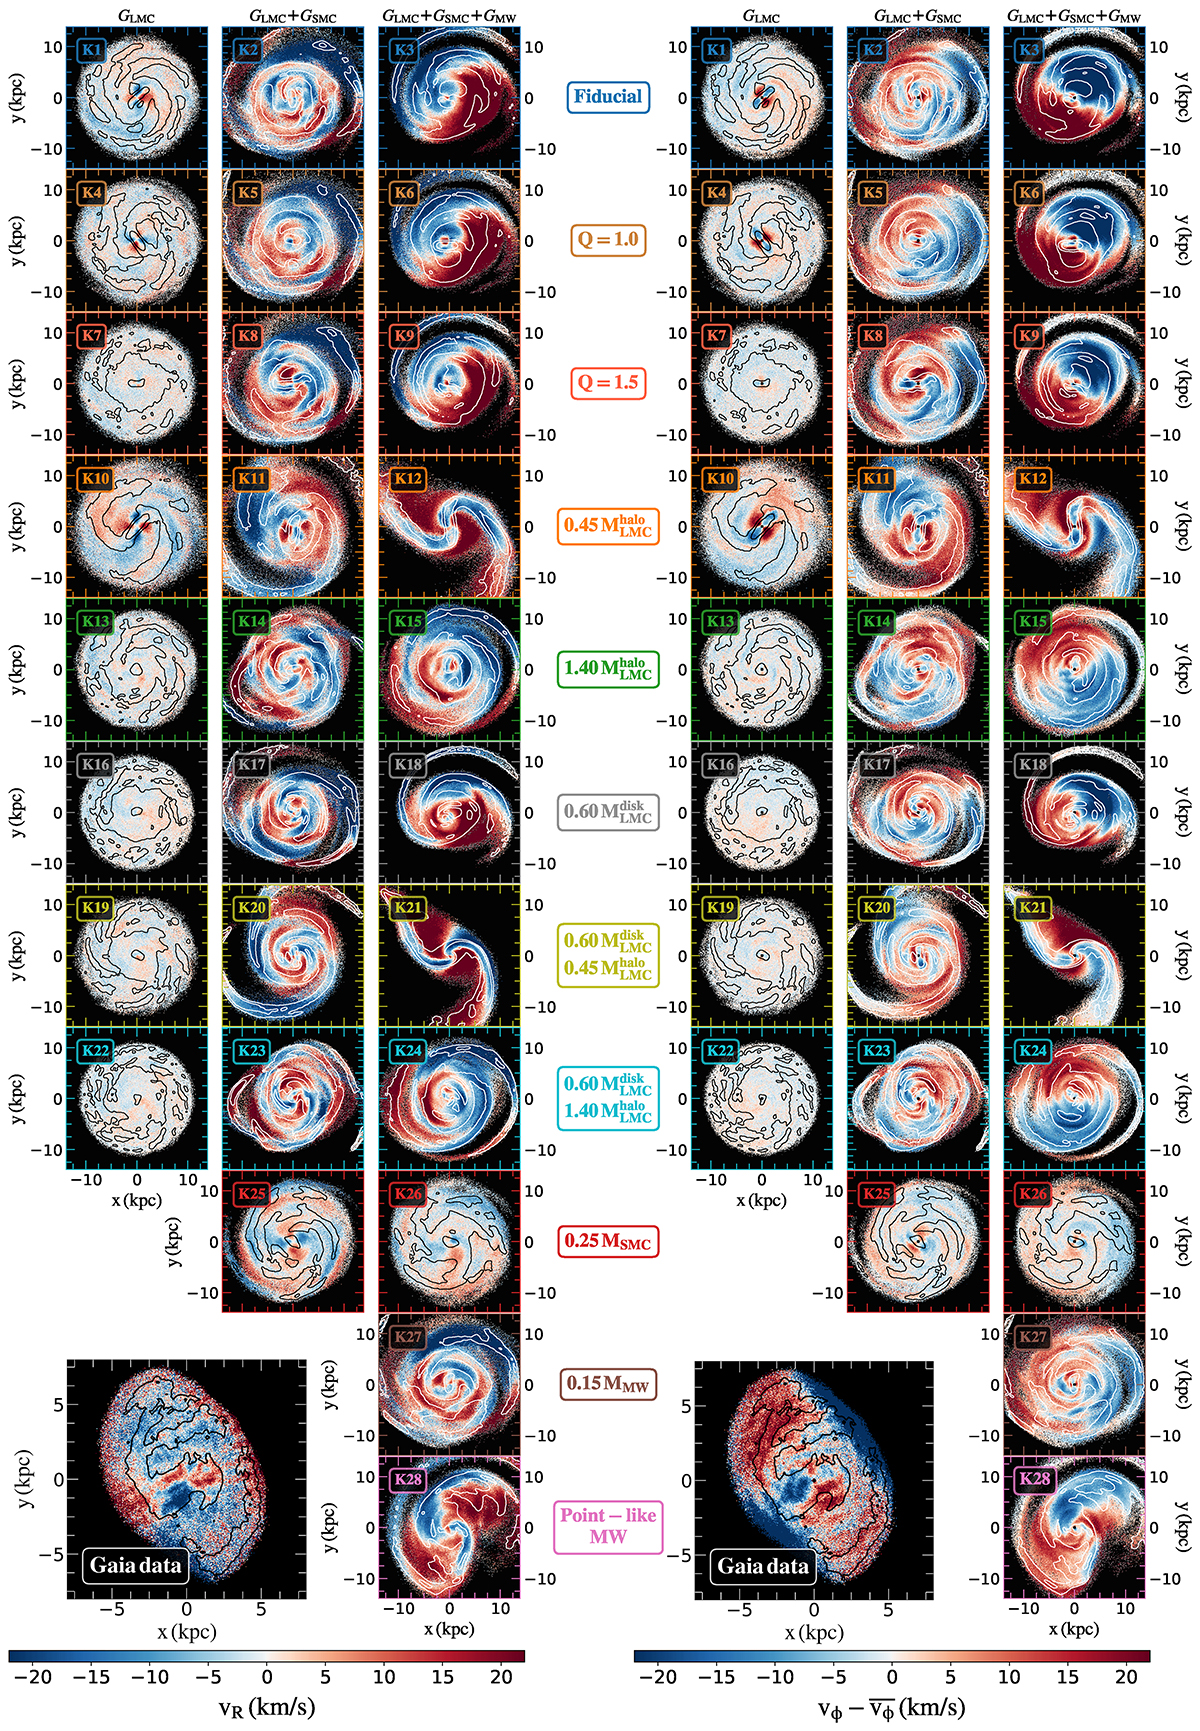
Fig. 4.
Download original image
Radial (left part) and residual tangential (right part) velocity maps of the GLMC disc as seen face-on at t = 0. Each row corresponds to a different set of simulations. For both velocity maps, we have the GLMC, GLMC + GSMC, and GLMC + GSMC + GMW models in the left, centre, and right panels, respectively. Black and white contour lines highlight the GLMC overdensities. As reference, the velocity map of the LMC optimal sample (Jiménez-Arranz et al. 2023) is shown in the bottom left part of each panel.
Current usage metrics show cumulative count of Article Views (full-text article views including HTML views, PDF and ePub downloads, according to the available data) and Abstracts Views on Vision4Press platform.
Data correspond to usage on the plateform after 2015. The current usage metrics is available 48-96 hours after online publication and is updated daily on week days.
Initial download of the metrics may take a while.