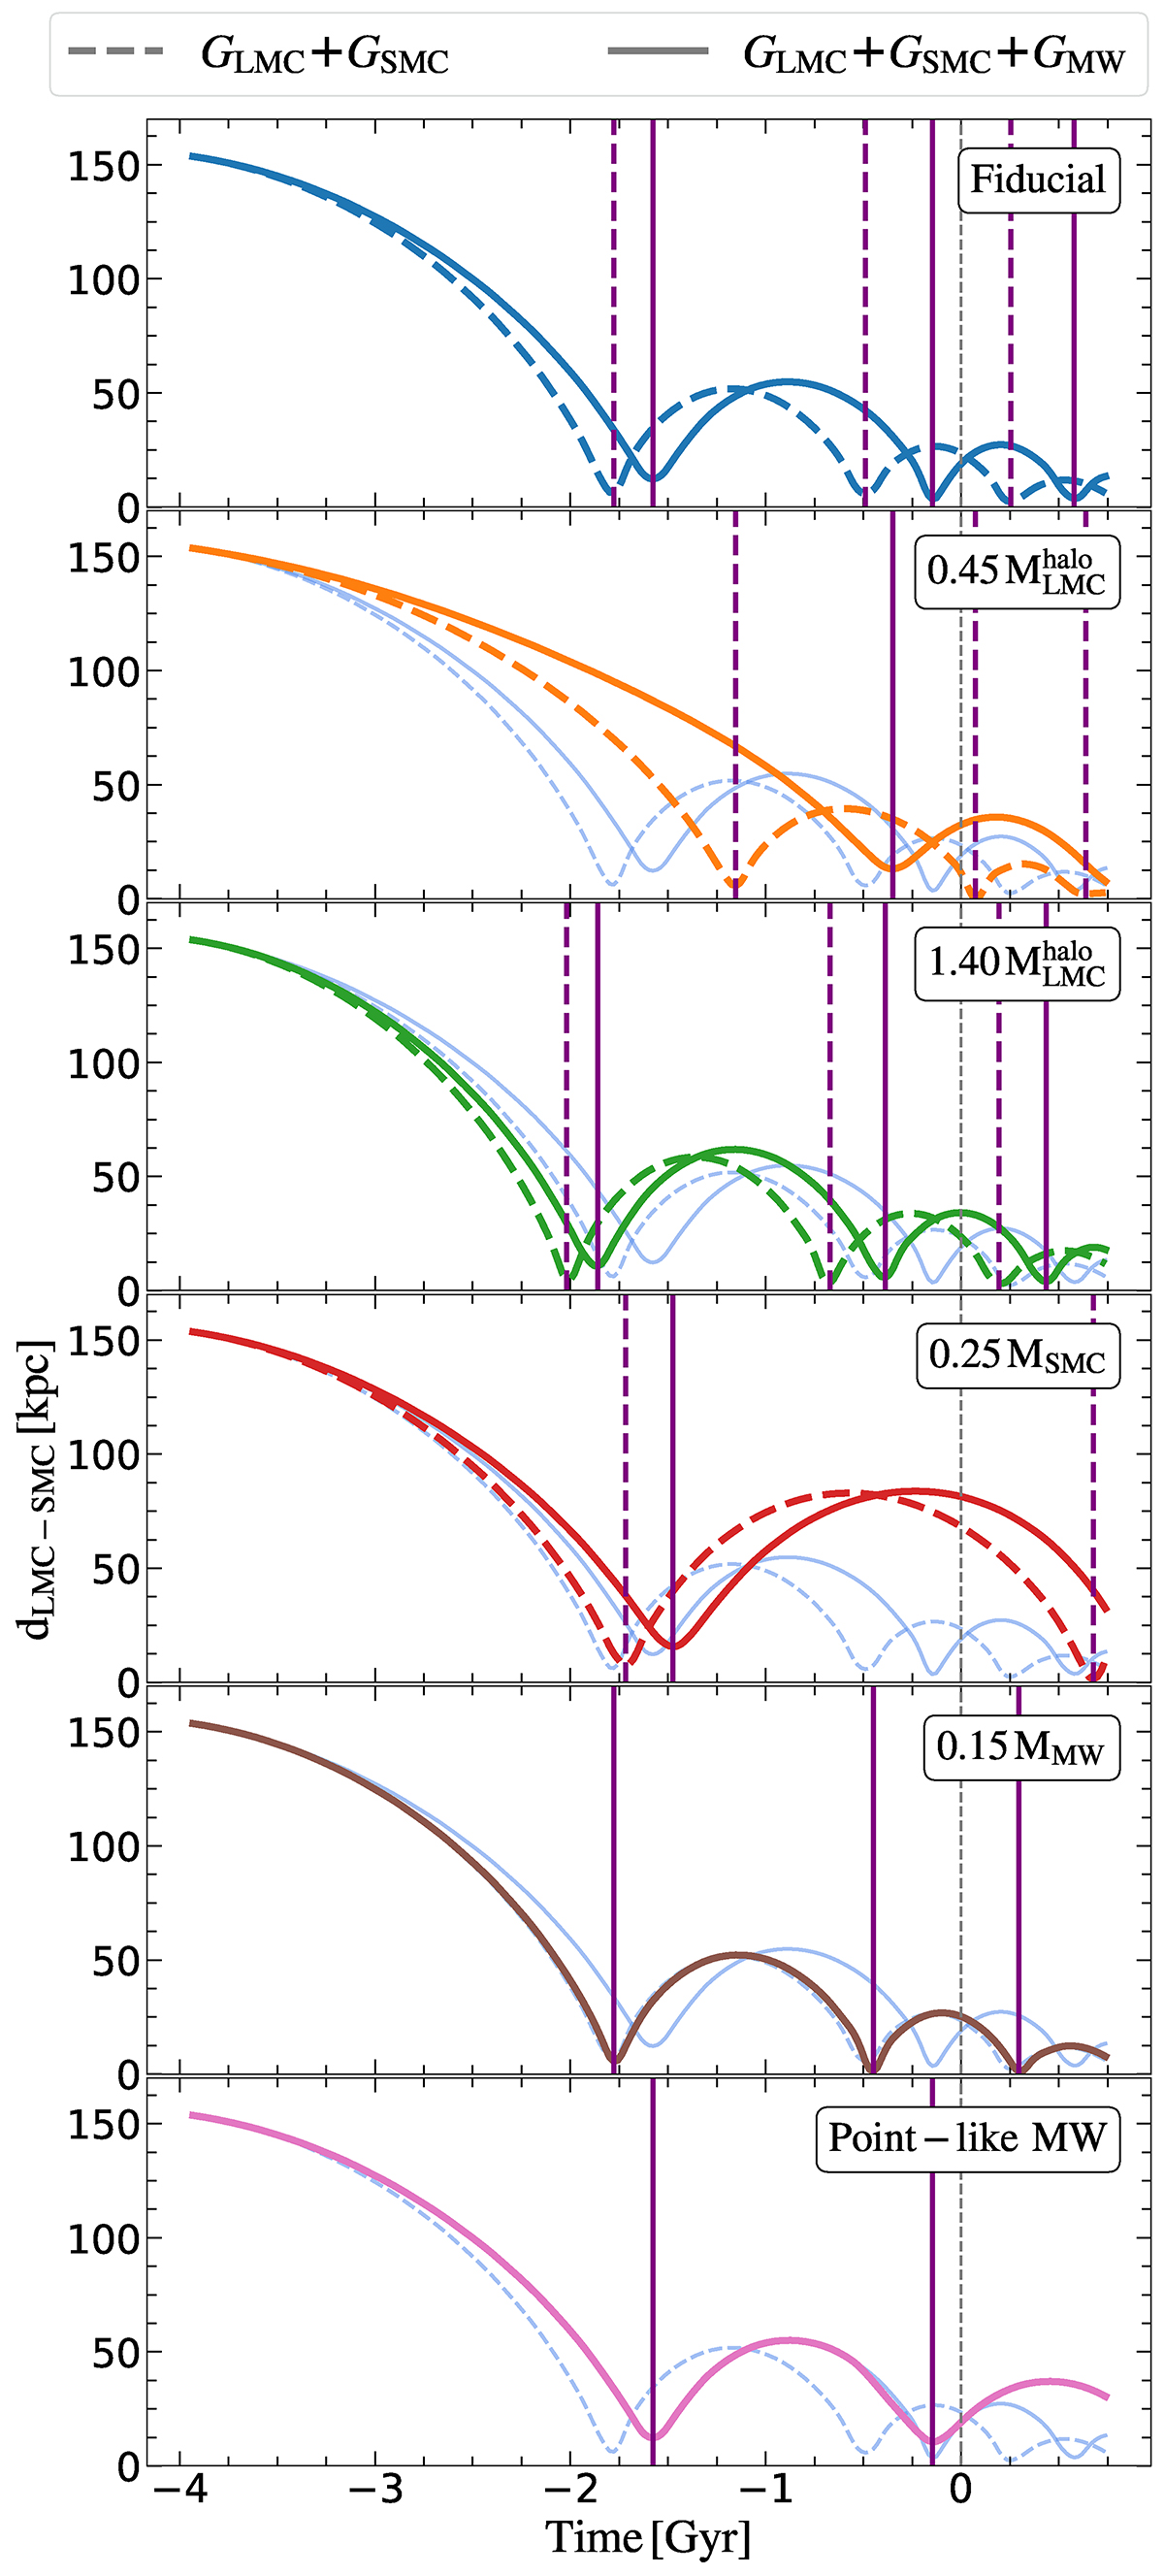
Fig. 1.
Download original image
Distance between the centre of mass of GLMC and that of GSMC. The solid (dashed) lines corresponds to the GLMC + GSMC + GMW (GLMC + GSMC) models. The different panels each represent a different set of simulations (see labels within each panel). The vertical purple solid (dashed) lines correspond to the GLMC − GSMC pericentres of the GLMC + GSMC + GMW (GLMC + GSMC) models. The vertical grey dashed line corresponds to the time we choose as the present time t = 0 (see Sect. 2.2). For the sake of comparison, in shadowed blue lines we plot the orbital history of the MCs for the models of the fiducial set. The set corresponding to a different GLMC disc mass and Toomre parameter is not shown since it shows no difference in comparison to the fiducial set.
Current usage metrics show cumulative count of Article Views (full-text article views including HTML views, PDF and ePub downloads, according to the available data) and Abstracts Views on Vision4Press platform.
Data correspond to usage on the plateform after 2015. The current usage metrics is available 48-96 hours after online publication and is updated daily on week days.
Initial download of the metrics may take a while.