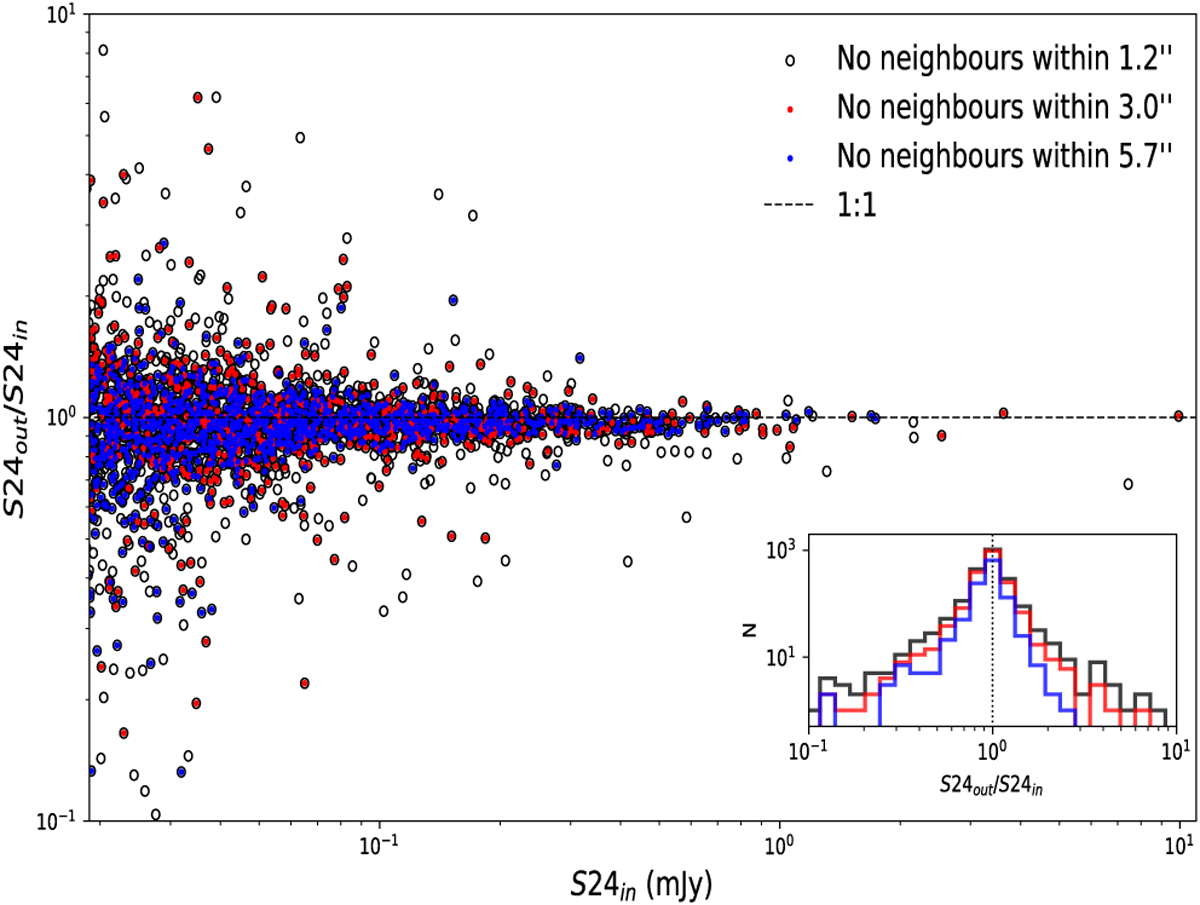
Fig. 9
Download original image
Similar to Fig. 8, but only for sources which have true flux S 24in > 18.8 μJy (i.e., above the 1σ instrument noise level) and do not have any neighbours in the prior list within a certain radius (black circles – no neighbours within 1.2″; red dots – no neighbours within 3.0″; blue dots- no neighbours within 5.7″). The inset shows the histograms of the ratio of the output XID+ flux to the input true flux for the three groups.
Current usage metrics show cumulative count of Article Views (full-text article views including HTML views, PDF and ePub downloads, according to the available data) and Abstracts Views on Vision4Press platform.
Data correspond to usage on the plateform after 2015. The current usage metrics is available 48-96 hours after online publication and is updated daily on week days.
Initial download of the metrics may take a while.