Fig. 21
Download original image
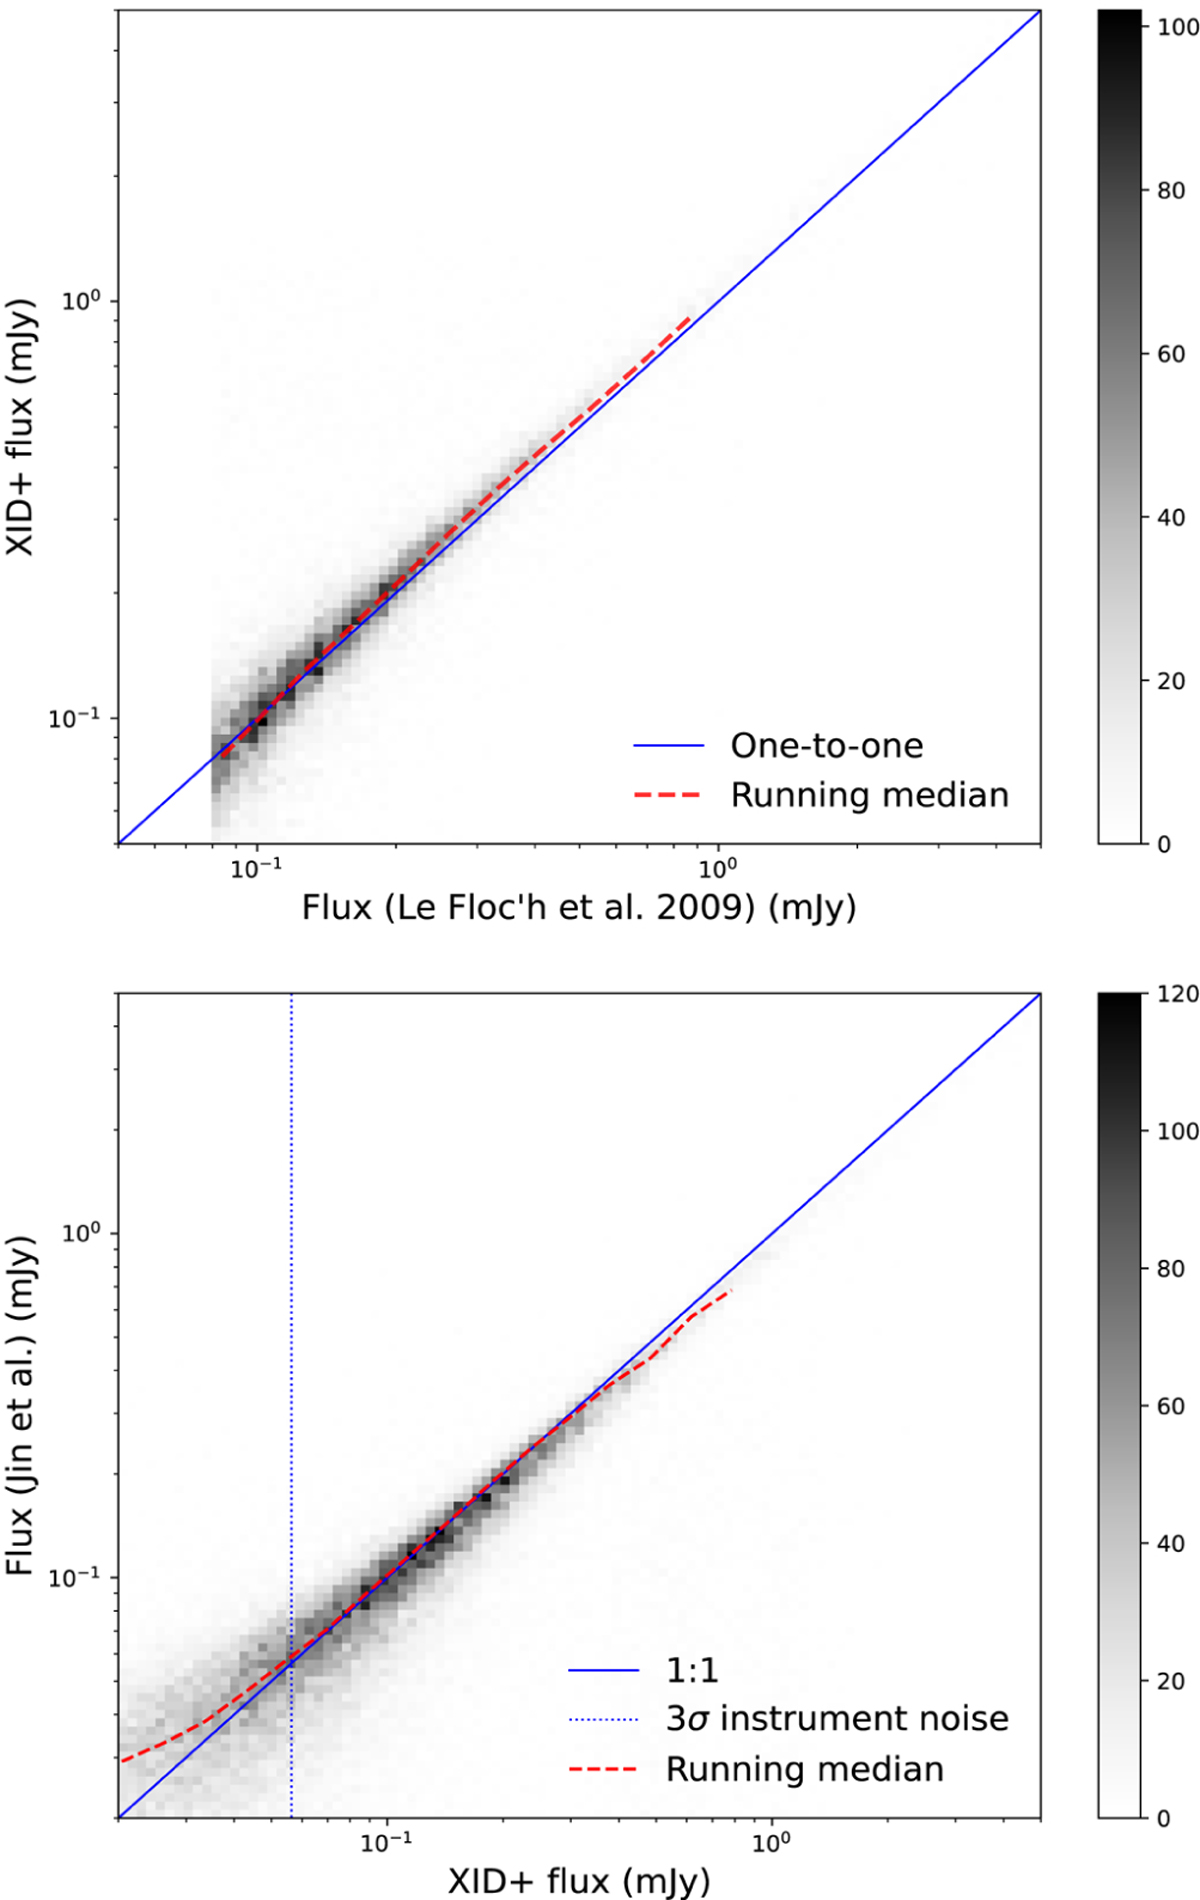
Spitzer MIPS 24 μm flux comparison. Top panel: A 2D histogram plot comparing the XID+ deblended fluxes with the blind catalogue from Le Floc’h et al. (2009). There is a good agreement down to the limit of the blind catalogue (80 μJy). Bottom panel: Comparison with the super deblended catalogue from Jin et al. (2018). Our deblended fluxes agree quite well with the super deblended fluxes, but with increasing scatter towards fainter sources.
Current usage metrics show cumulative count of Article Views (full-text article views including HTML views, PDF and ePub downloads, according to the available data) and Abstracts Views on Vision4Press platform.
Data correspond to usage on the plateform after 2015. The current usage metrics is available 48-96 hours after online publication and is updated daily on week days.
Initial download of the metrics may take a while.