Fig. 4.
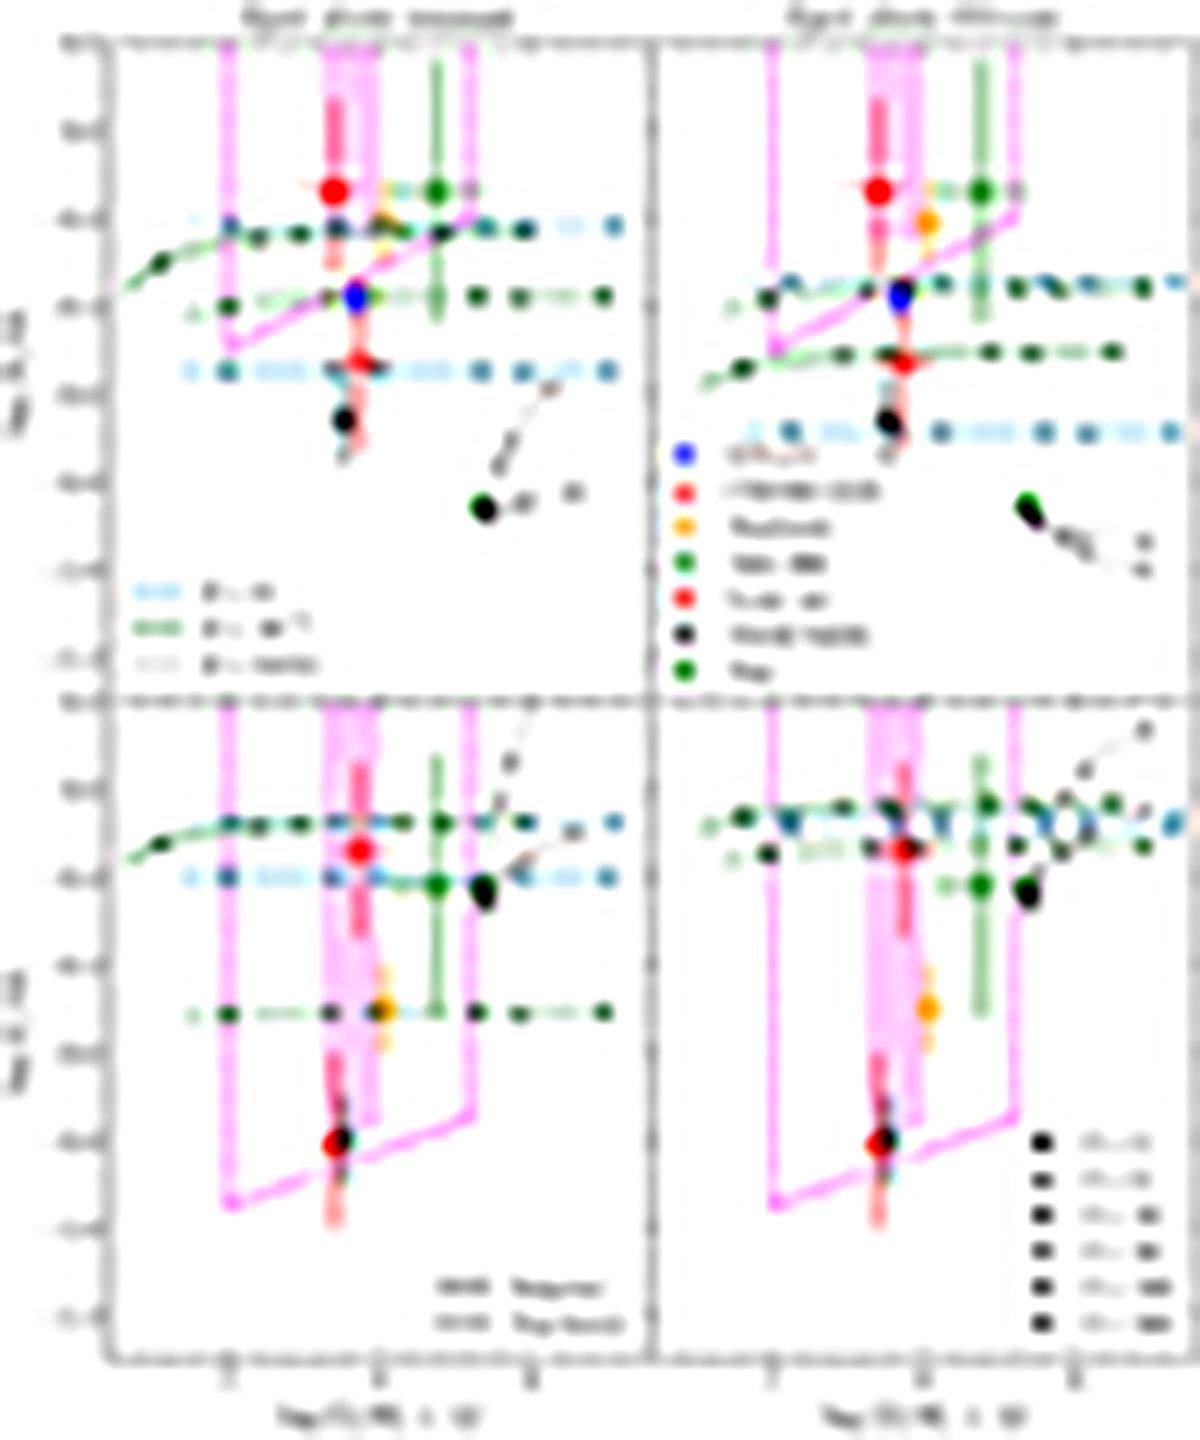
Download original image
Abundance ratios in the diluted ISM with varying dilution factor, f = 1 − 1000. Top row: log(N/O) vs log(O/H) + 12. Bottom row: log(C/O) vs log(O/H) + 12. Left column: Scenarios where the stars eject everything above the remnant mass. Right column: Scenarios where the stars eject everything above the CO core. In each panel, we show the results for three of the six metallicities: Z = 0 (Pop III, cyan), Z = 10−5 (EMP, green), and Z = 0.014 (solar, grey). Solid lines represent populations sampled from a Salpeter IMF and dashed lines from a top-heavy IMF. The markers on these lines represent specific values for f = 1 − 500. The other markers (as indicated in the top right panel), pink dashed lines and pink-shaded regions show results and lower bounds from observations, taken from Marques-Chaves et al. (2024). These results, as well as those for the remaining three metallicities not shown on this figure, can be found in tabular form in Tables 2 and 3.
Current usage metrics show cumulative count of Article Views (full-text article views including HTML views, PDF and ePub downloads, according to the available data) and Abstracts Views on Vision4Press platform.
Data correspond to usage on the plateform after 2015. The current usage metrics is available 48-96 hours after online publication and is updated daily on week days.
Initial download of the metrics may take a while.