Fig. 1.
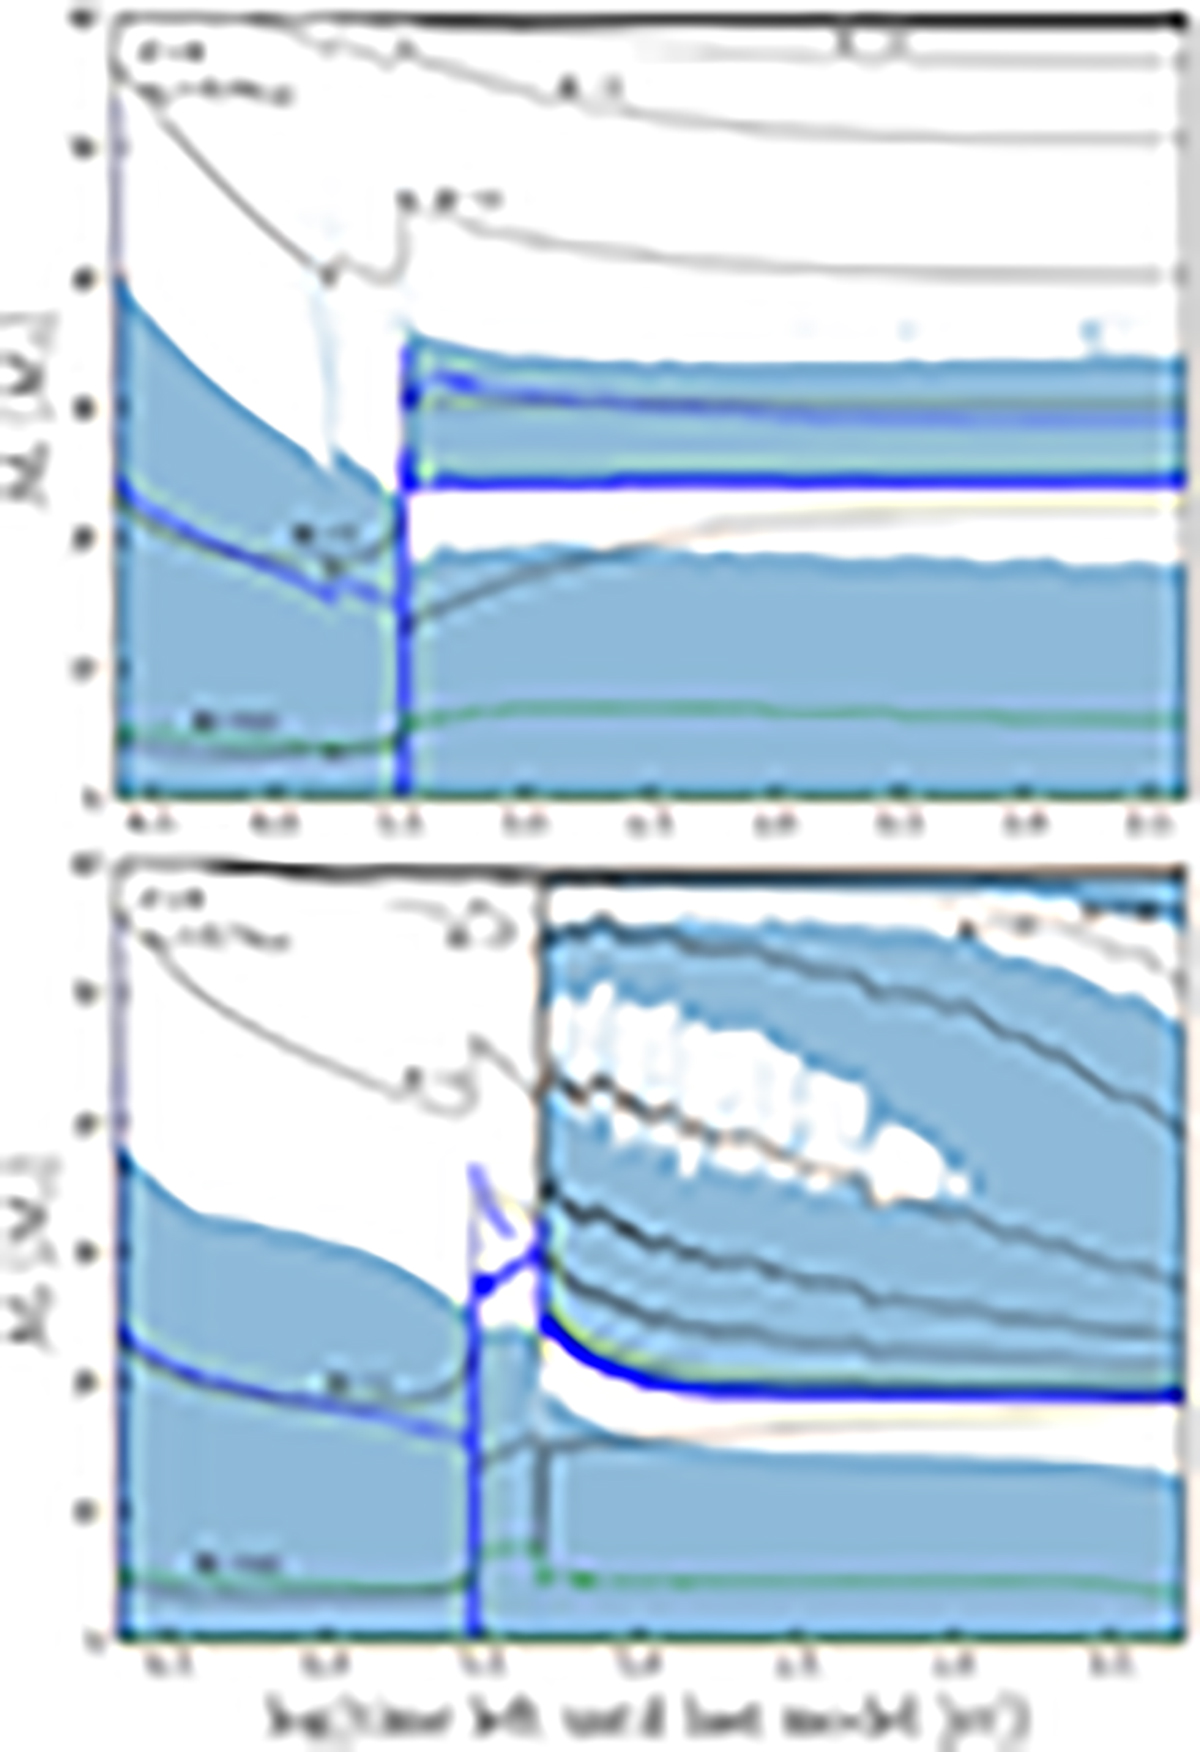
Download original image
Kippenhahn diagrams displaying the structural evolution in lagrangian coordinates. Pop III models are presented with 60 M⊙, and with an initial rotation of 40% (by Murphy et al. 2021, top panel) and 70% (by Tsiatsiou et al. 2024, bottom panel) of the critical rotation velocity. The last evolutionary stage for both models is the end of the core He-burning phase. The blue regions are convective zones, while the white ones are radiative. The black lines are iso-radius lines (in units of solar radius, R⊙). The blue and green lines show the mass coordinates where hydrogen and helium are burning, respectively. The solid lines indicate the peak of the energy generation rate, and the dashed ones delimit 10% of the peak energy generation rate for each burning phase.
Current usage metrics show cumulative count of Article Views (full-text article views including HTML views, PDF and ePub downloads, according to the available data) and Abstracts Views on Vision4Press platform.
Data correspond to usage on the plateform after 2015. The current usage metrics is available 48-96 hours after online publication and is updated daily on week days.
Initial download of the metrics may take a while.