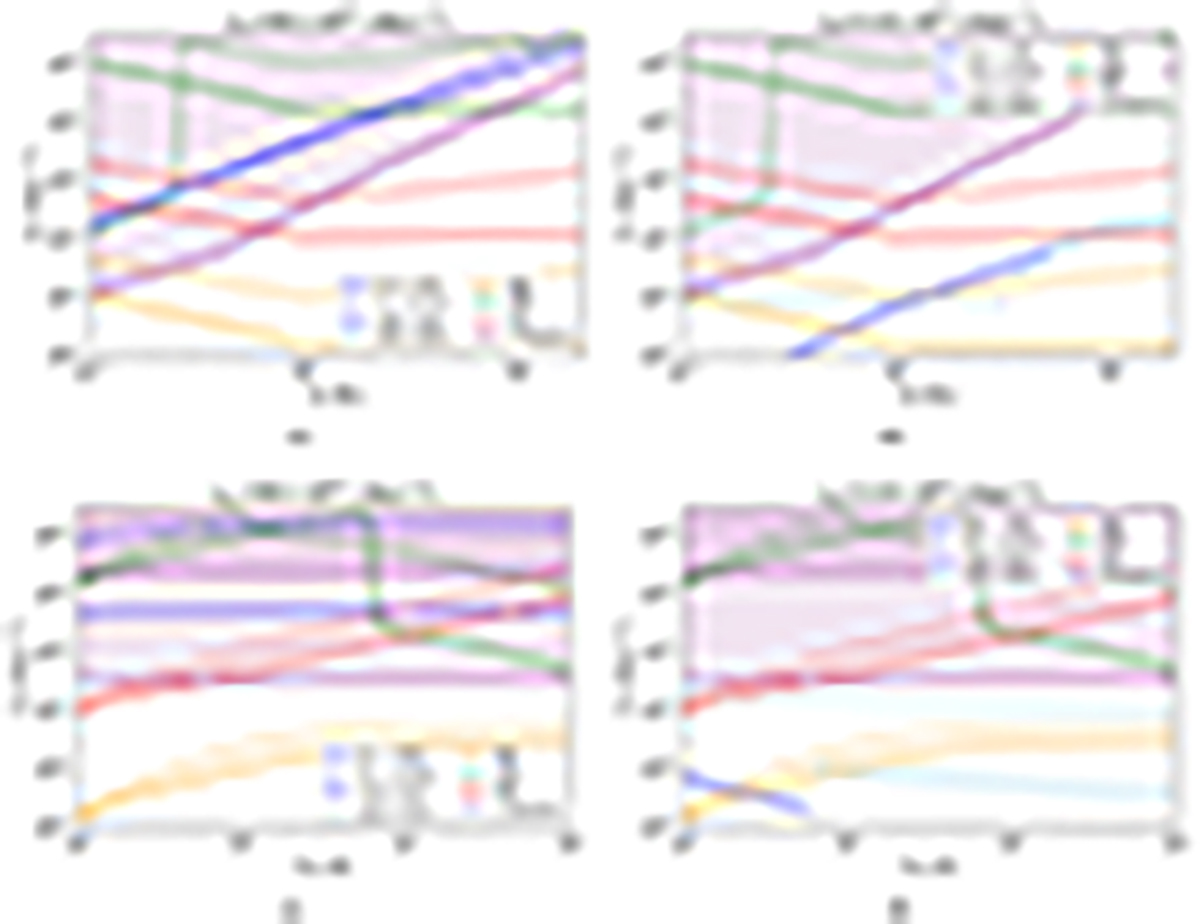
Fig. 5.
Download original image
Comparison of the re-emission from bursts and the persistent preburst radiation with Lw = 9.6 × 1044 erg s−1 (left panels) and Lw = 5.0 × 1034 erg s−1 (right panels) for different Porb and different Mc. Different colors represent different mechanisms, as indicated in the caption. We note that we show both Case I (blue lines) and Case II (light blue lines) for the persistent preburst radiation. The colored region means νLν > Lc, where the radiation will not be outshined by Lc. In the top panel, we show the variation of the peak luminosity νLν with Mc for a given Porb = 1 and 10 d. In the bottom panel, we show the variation of νLν with Porb for a given Mc = 1 and 10 M⊙.
Current usage metrics show cumulative count of Article Views (full-text article views including HTML views, PDF and ePub downloads, according to the available data) and Abstracts Views on Vision4Press platform.
Data correspond to usage on the plateform after 2015. The current usage metrics is available 48-96 hours after online publication and is updated daily on week days.
Initial download of the metrics may take a while.