Fig. 4.
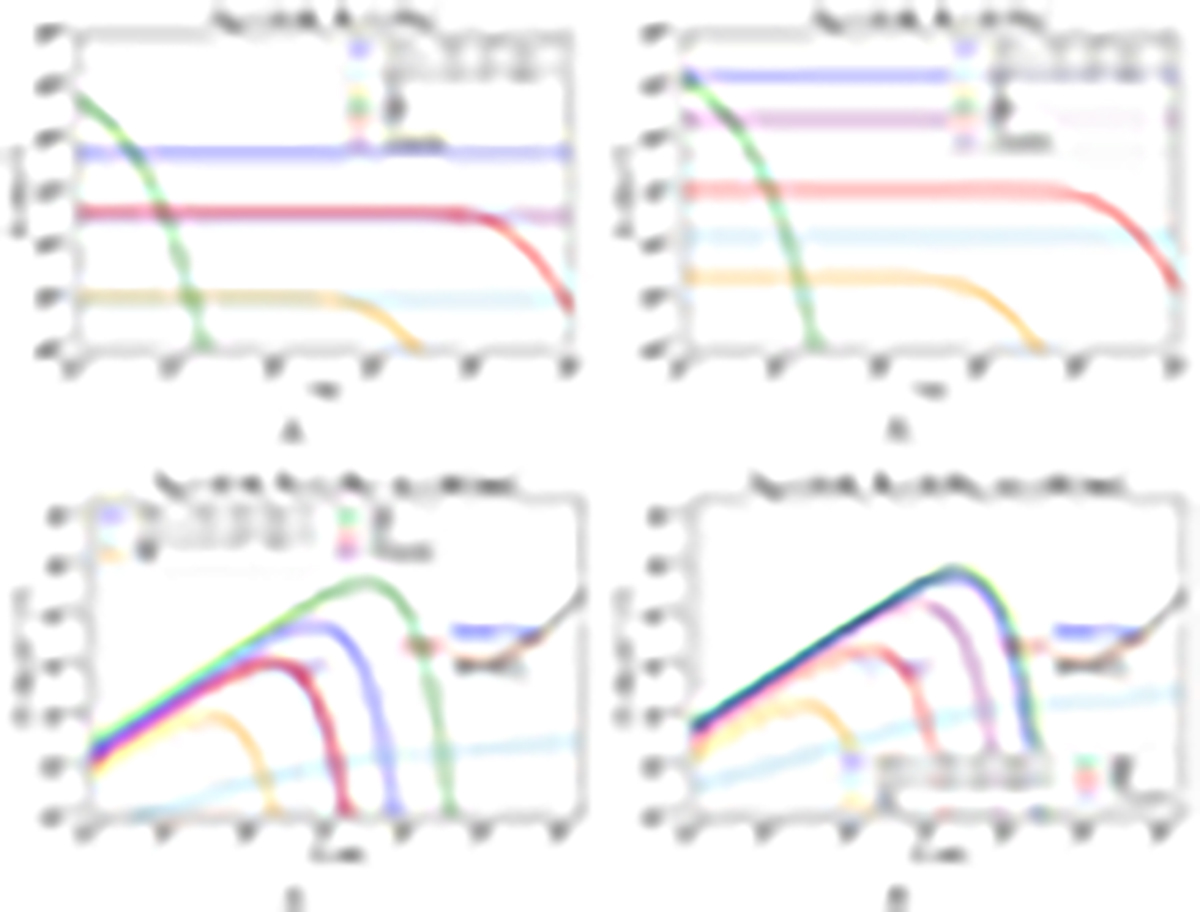
Download original image
Spectra and light curves with Mc = 1 M⊙ (left panels) and 10 M⊙ (right panels) in a binary system with Porb = 10 d. Differently colored lines represent different mechanisms, as indicated in the legends. The blue line shows the persistent preburst radiation for Lw = 9.6 × 1044 erg s−1 corresponding to Case I, and the light blue line indicates that for Lw = 5.0 × 1034 erg s−1 corresponding to Case II. In the top panels, we show the light curves. In the bottom panels, we show the spectra for different mechanisms at a distance of d = 100 kpc. The sensitivity curves of Einstein Probe (blue line), Chandra (pink line), and XMM-Newton (black line) are calculated with an exposure time of 103 s, which can be derived from sensitivity proportional to the −1/2 power of the exposure time (Lucchetta et al. 2022; Yuan et al. 2022), and the r-band sensitivity of the Vera C. Rubin Observatory (purple line) is calculated with a point source exposure time of 30 s (Yuan et al. 2021).
Current usage metrics show cumulative count of Article Views (full-text article views including HTML views, PDF and ePub downloads, according to the available data) and Abstracts Views on Vision4Press platform.
Data correspond to usage on the plateform after 2015. The current usage metrics is available 48-96 hours after online publication and is updated daily on week days.
Initial download of the metrics may take a while.