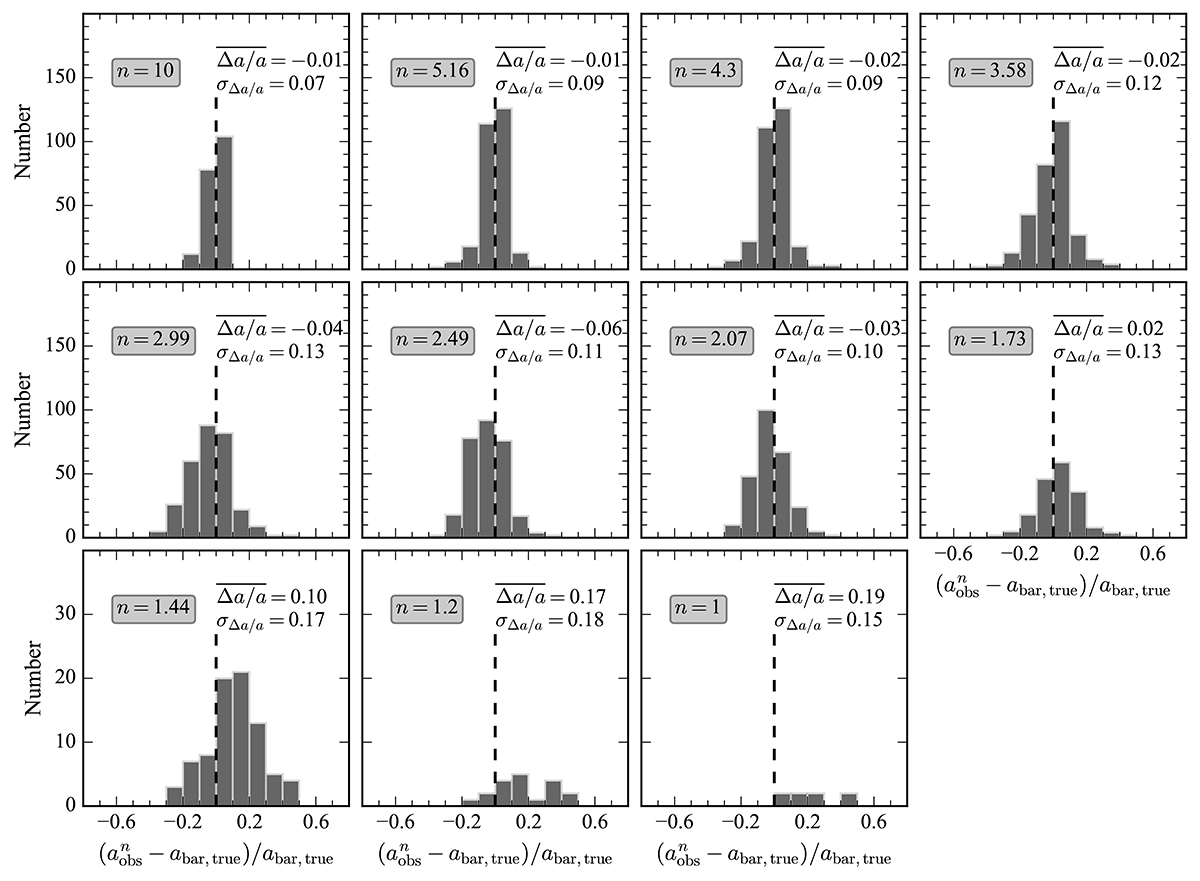
Fig. 8.
Download original image
Distribution of the fractional difference ![]() , where
, where ![]() , at various resolution levels n = abar, true/FWHM. The abar, true denotes the intrinsic value. We present the results for the F200W PSF. The averaged fractional difference (
, at various resolution levels n = abar, true/FWHM. The abar, true denotes the intrinsic value. We present the results for the F200W PSF. The averaged fractional difference (![]() ) and standard deviation (σΔa/a) are indicated at the top of each panel. The vertical dashed black line in each panel marks
) and standard deviation (σΔa/a) are indicated at the top of each panel. The vertical dashed black line in each panel marks ![]() .
.
Current usage metrics show cumulative count of Article Views (full-text article views including HTML views, PDF and ePub downloads, according to the available data) and Abstracts Views on Vision4Press platform.
Data correspond to usage on the plateform after 2015. The current usage metrics is available 48-96 hours after online publication and is updated daily on week days.
Initial download of the metrics may take a while.