Open Access
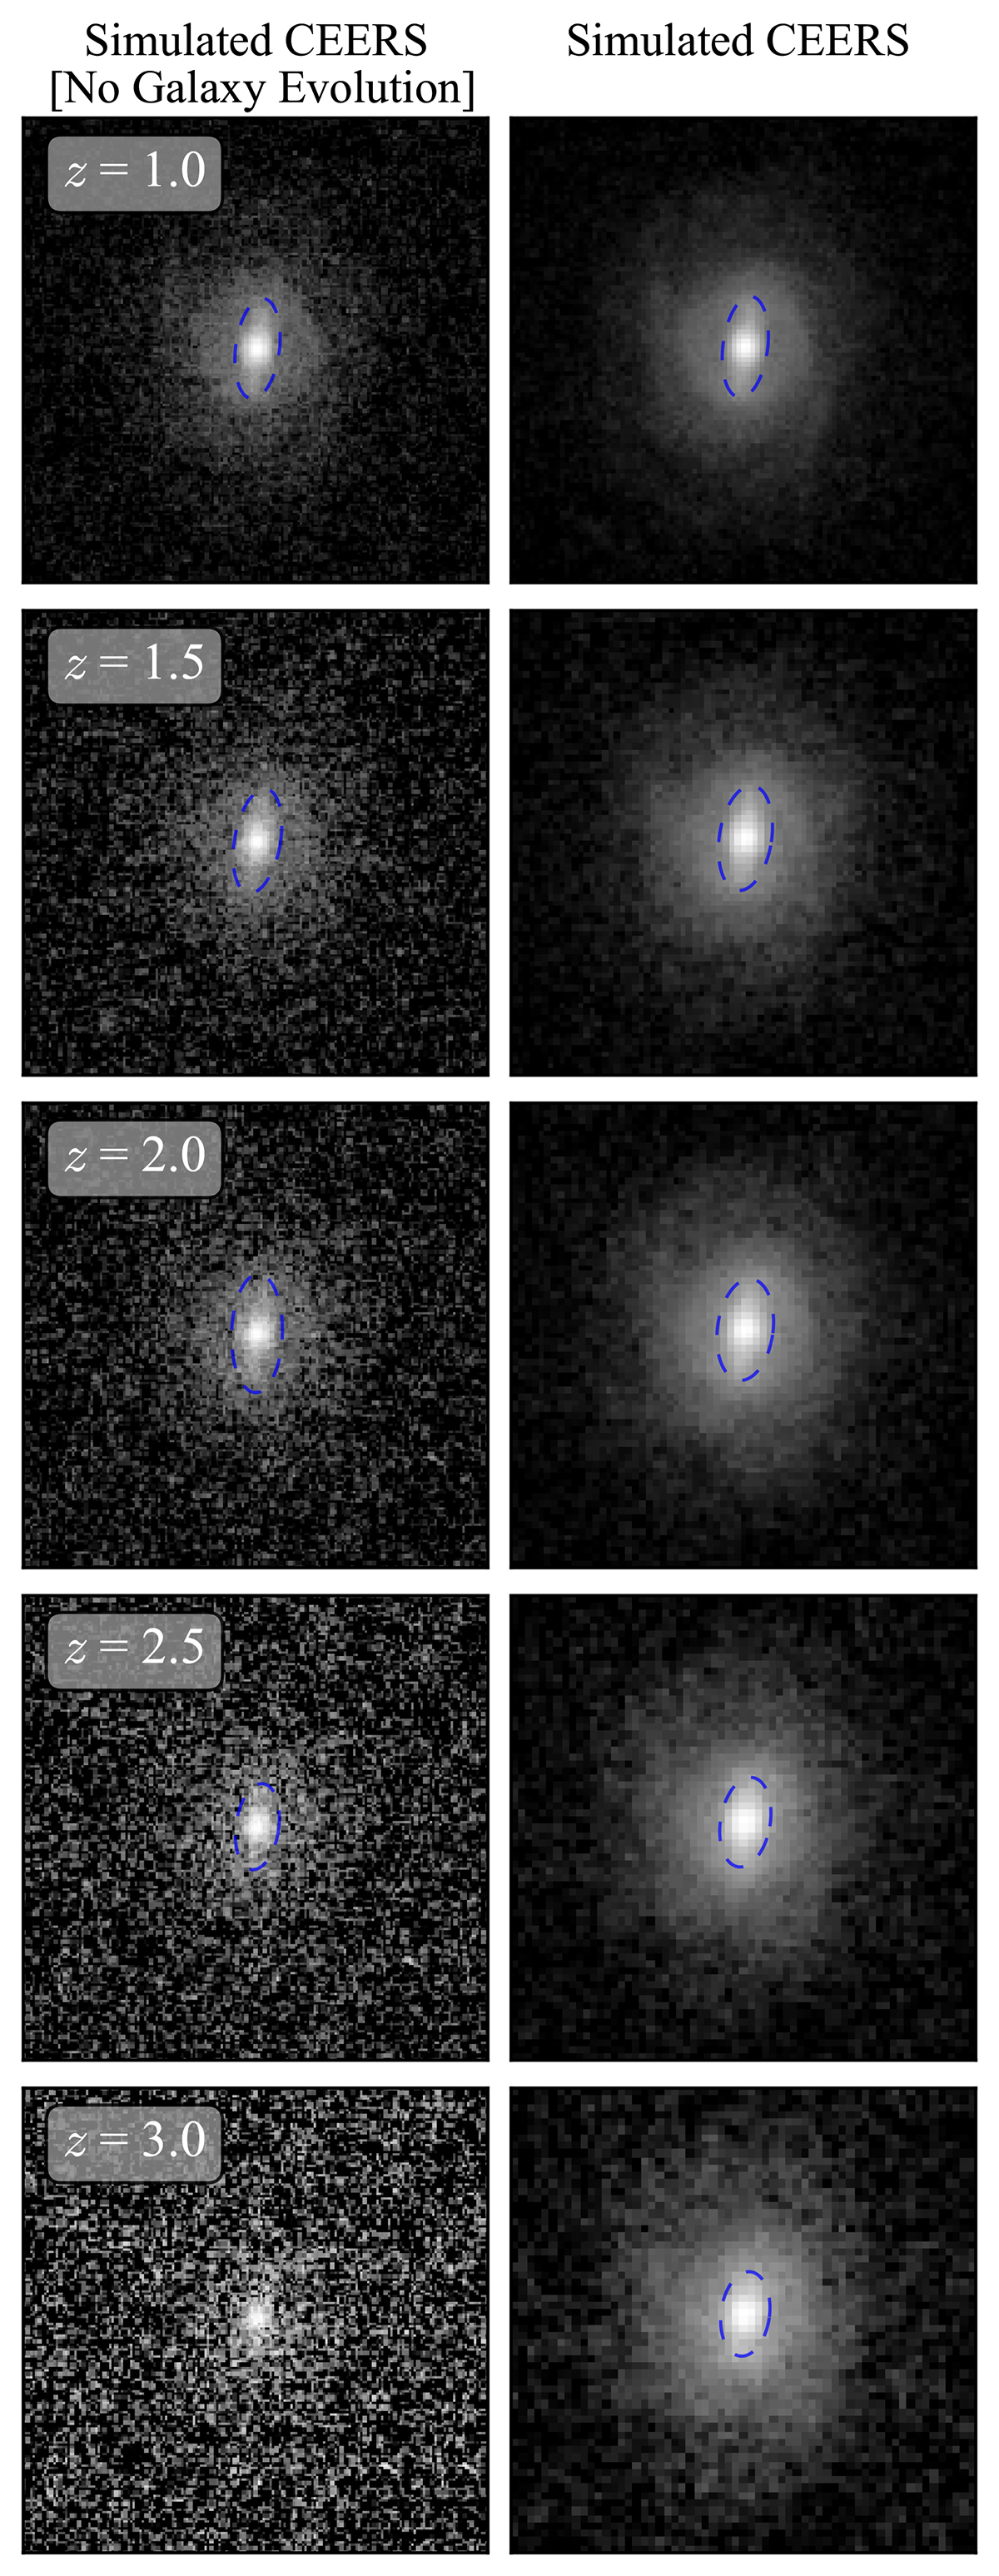
Fig. 6.
Download original image
Simulated CEERS image with (on the right) and without (on the left) a galaxy evolution model using PGC049413 as an example, presented as the redshift increases. The blue ellipse marks the detected bar structure in the image if a bar is identified.
Current usage metrics show cumulative count of Article Views (full-text article views including HTML views, PDF and ePub downloads, according to the available data) and Abstracts Views on Vision4Press platform.
Data correspond to usage on the plateform after 2015. The current usage metrics is available 48-96 hours after online publication and is updated daily on week days.
Initial download of the metrics may take a while.