Open Access
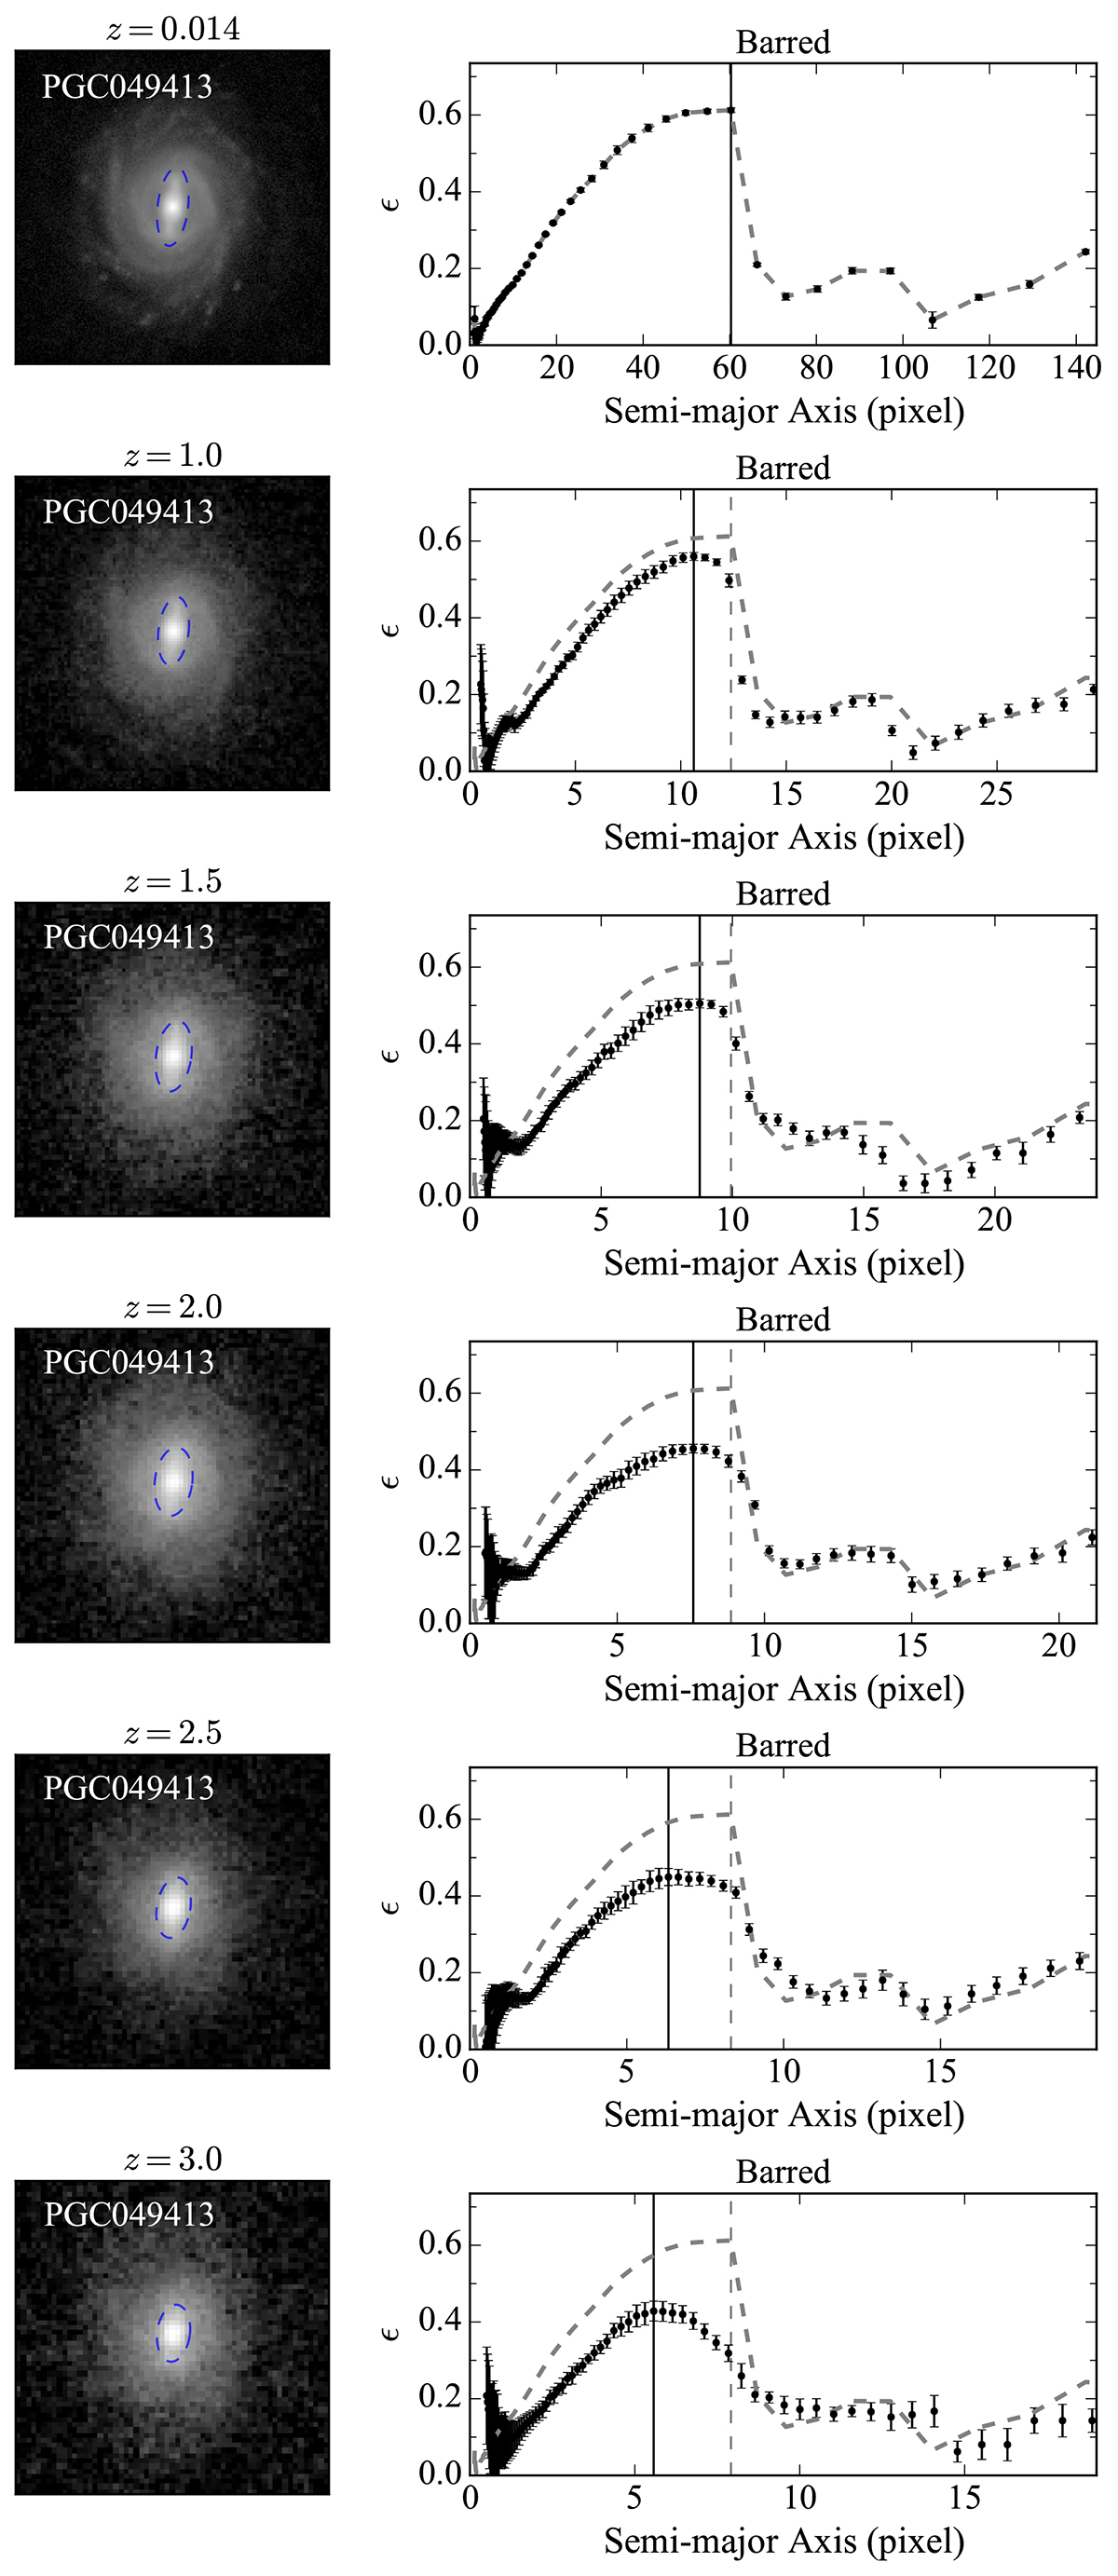
Fig. 5.
Download original image
Impact of redshift effects on the bar analysis. The redshift effects include observational effects and galaxy (and bar) evolution. The symbols are the same as in Fig. 2, but we show simulated CEERS images at various redshifts and their results.
Current usage metrics show cumulative count of Article Views (full-text article views including HTML views, PDF and ePub downloads, according to the available data) and Abstracts Views on Vision4Press platform.
Data correspond to usage on the plateform after 2015. The current usage metrics is available 48-96 hours after online publication and is updated daily on week days.
Initial download of the metrics may take a while.