Fig. 15.
Download original image
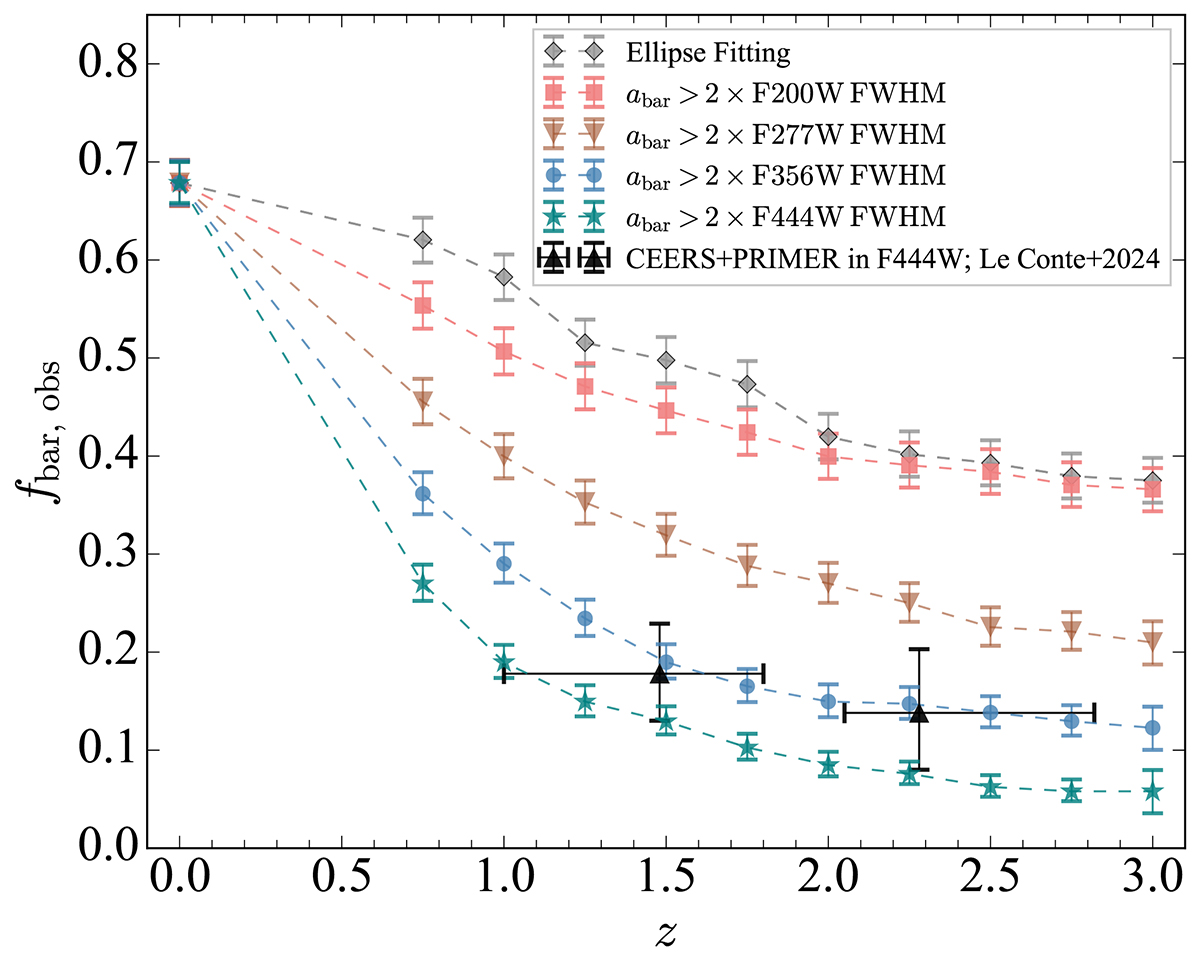
Measured bar fraction (fbar, obs) obtained from simulated CEERS images as a function of redshift (z). The gray diamonds represent the fbar, obs obtained using the ellipse-fitting method for simulated CEERS images. The other symbols mark the results obtained by adopting the criterion of abar, true > 2 × FWHM for a bar detection for specific JWST NIRcam filters. The pink rectangles, brown inverted triangles, blue dots, and green stars represent the fbar, obs for F200W, F277W, F356W, and F444W filter, respectively. The black triangles correspond to the observed F444W-band bar fraction measured by Le Conte et al. (2024).
Current usage metrics show cumulative count of Article Views (full-text article views including HTML views, PDF and ePub downloads, according to the available data) and Abstracts Views on Vision4Press platform.
Data correspond to usage on the plateform after 2015. The current usage metrics is available 48-96 hours after online publication and is updated daily on week days.
Initial download of the metrics may take a while.