Fig. 12.
Download original image
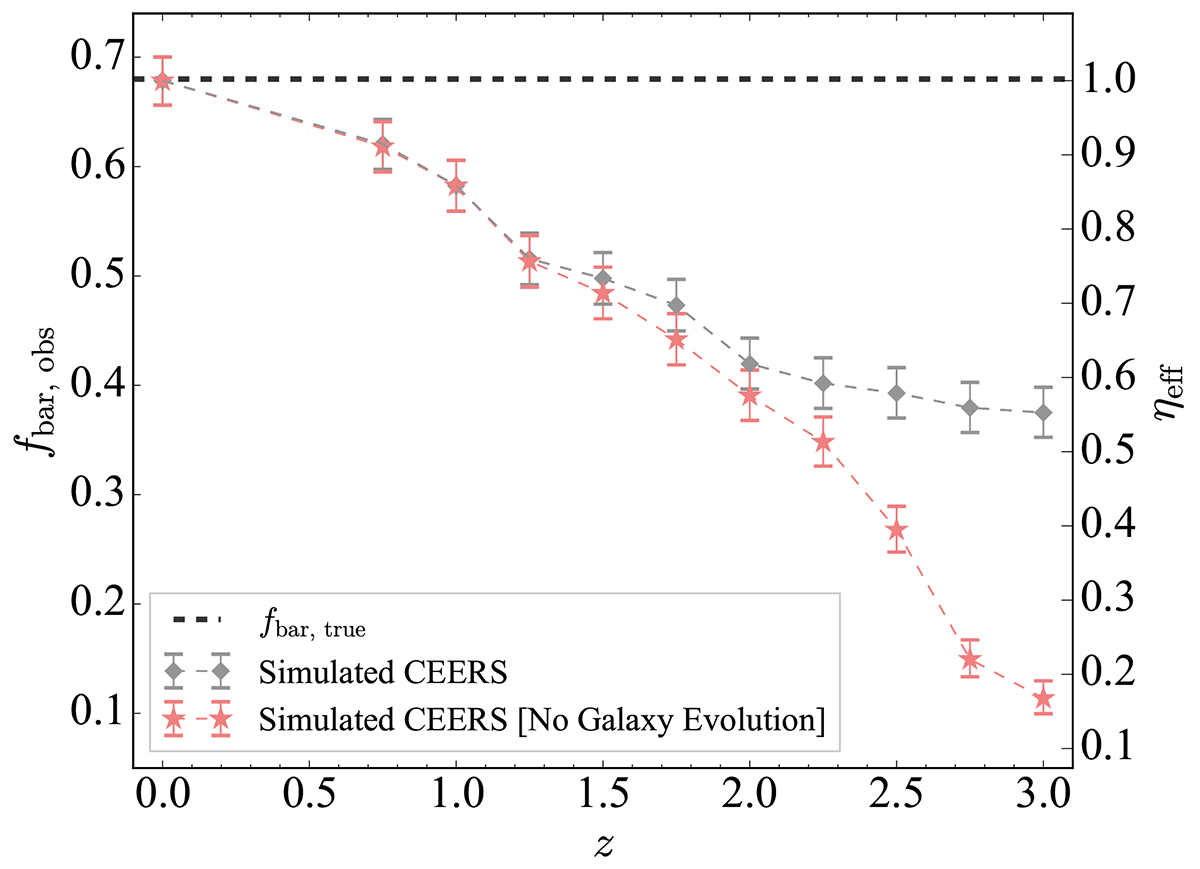
Dependence of the fraction of bars (fbar, obs) and effectiveness of detecting bars (ηeff), measured from the simulated CEERS images as a function of redshift (z). The gray diamonds represent the results obtained from the simulated data with the galaxy evolution model, and the pink stars represent those from the data without a model. The error bars denote the uncertainty of fbar, obs. For the simulated CEERS images, the F115W, F150W, and F200W filters are used for redshift range z = 0.75–1.0, 1.25–1.75, and 2.0–3.0, respectively. The horizontal dashed line represents the fbar, true of 68% of our sample.
Current usage metrics show cumulative count of Article Views (full-text article views including HTML views, PDF and ePub downloads, according to the available data) and Abstracts Views on Vision4Press platform.
Data correspond to usage on the plateform after 2015. The current usage metrics is available 48-96 hours after online publication and is updated daily on week days.
Initial download of the metrics may take a while.