Fig. 6
Download original image
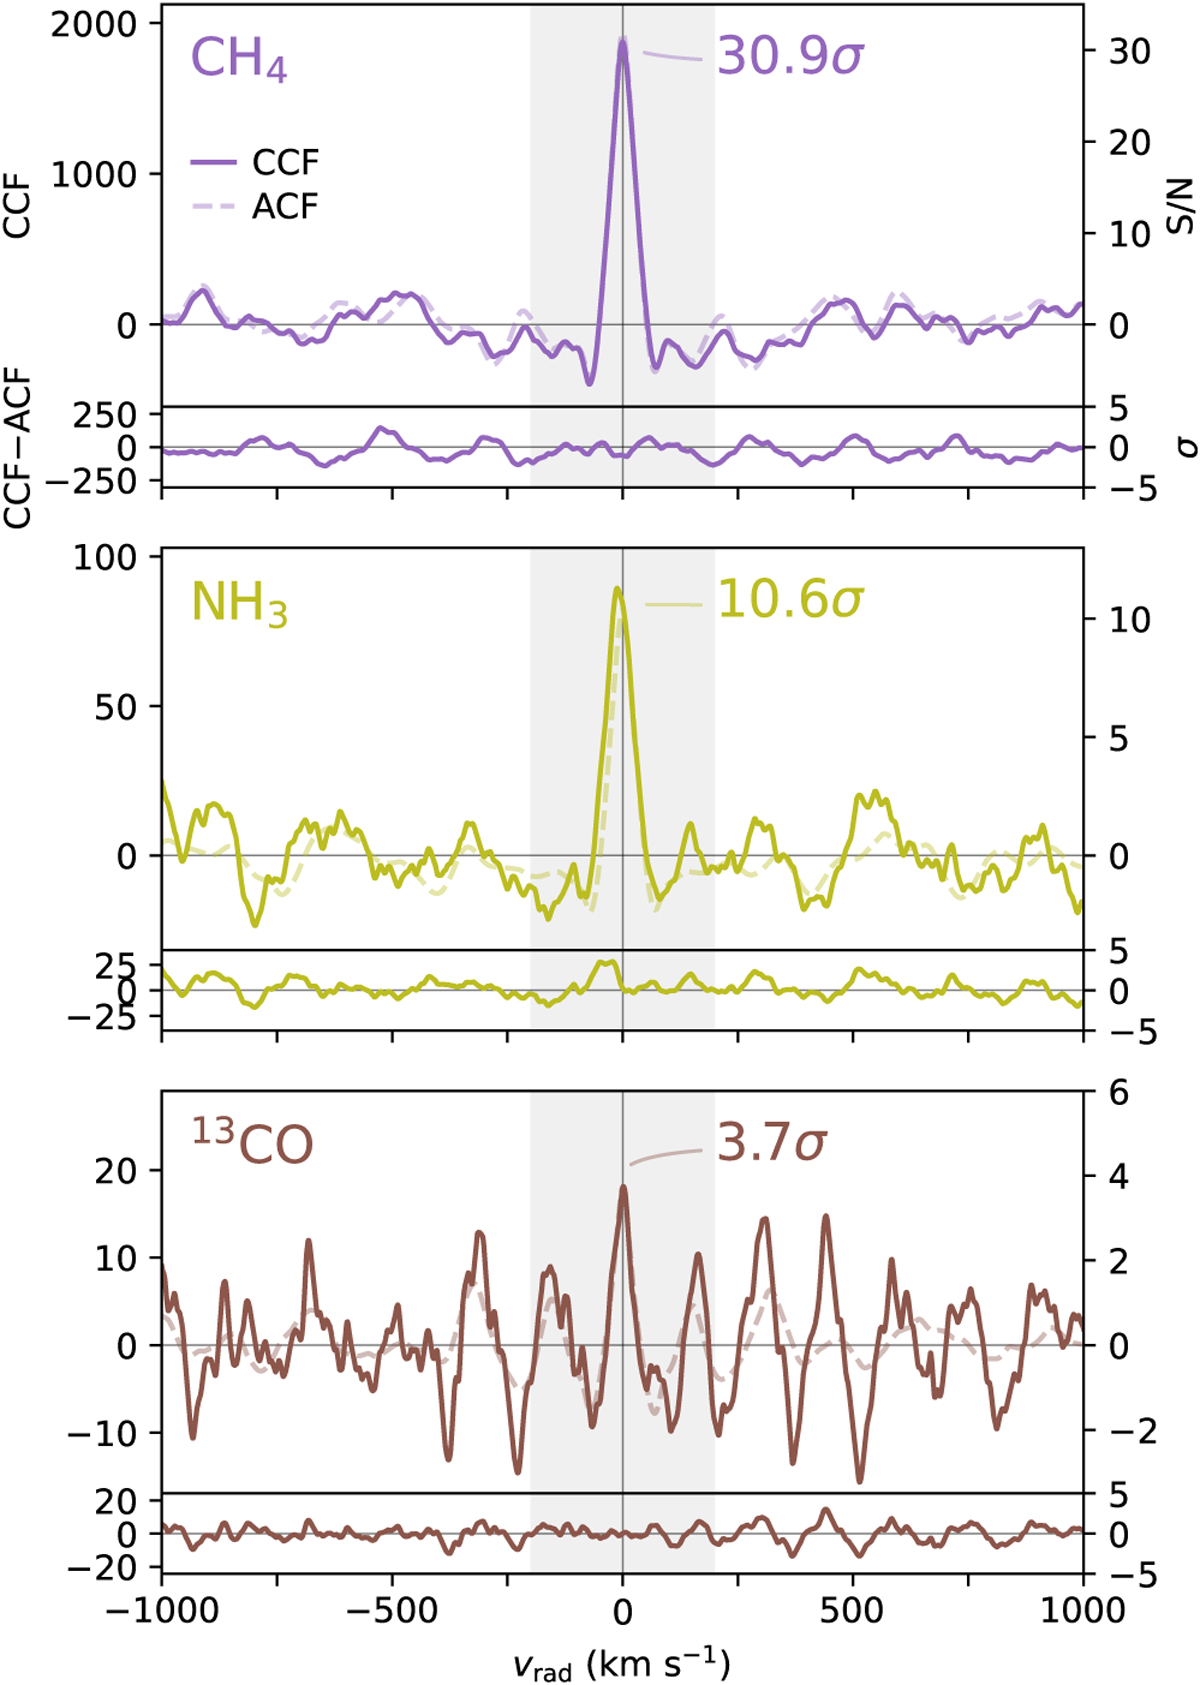
Cross-correlation analysis of CH4, NH3, and 13CO. For each species, the upper panel shows the CCF (solid) and ACF (dashed) with the S/N indicated on the right-hand side. The lower panels present the residuals of CCF-ACF which are used to estimate the noise outside of the expected peak. The cross-correlation was performed on the observed spectrum centred in its rest frame, which resulted in peaks around 0 km s−1.
Current usage metrics show cumulative count of Article Views (full-text article views including HTML views, PDF and ePub downloads, according to the available data) and Abstracts Views on Vision4Press platform.
Data correspond to usage on the plateform after 2015. The current usage metrics is available 48-96 hours after online publication and is updated daily on week days.
Initial download of the metrics may take a while.