Fig. 5
Download original image
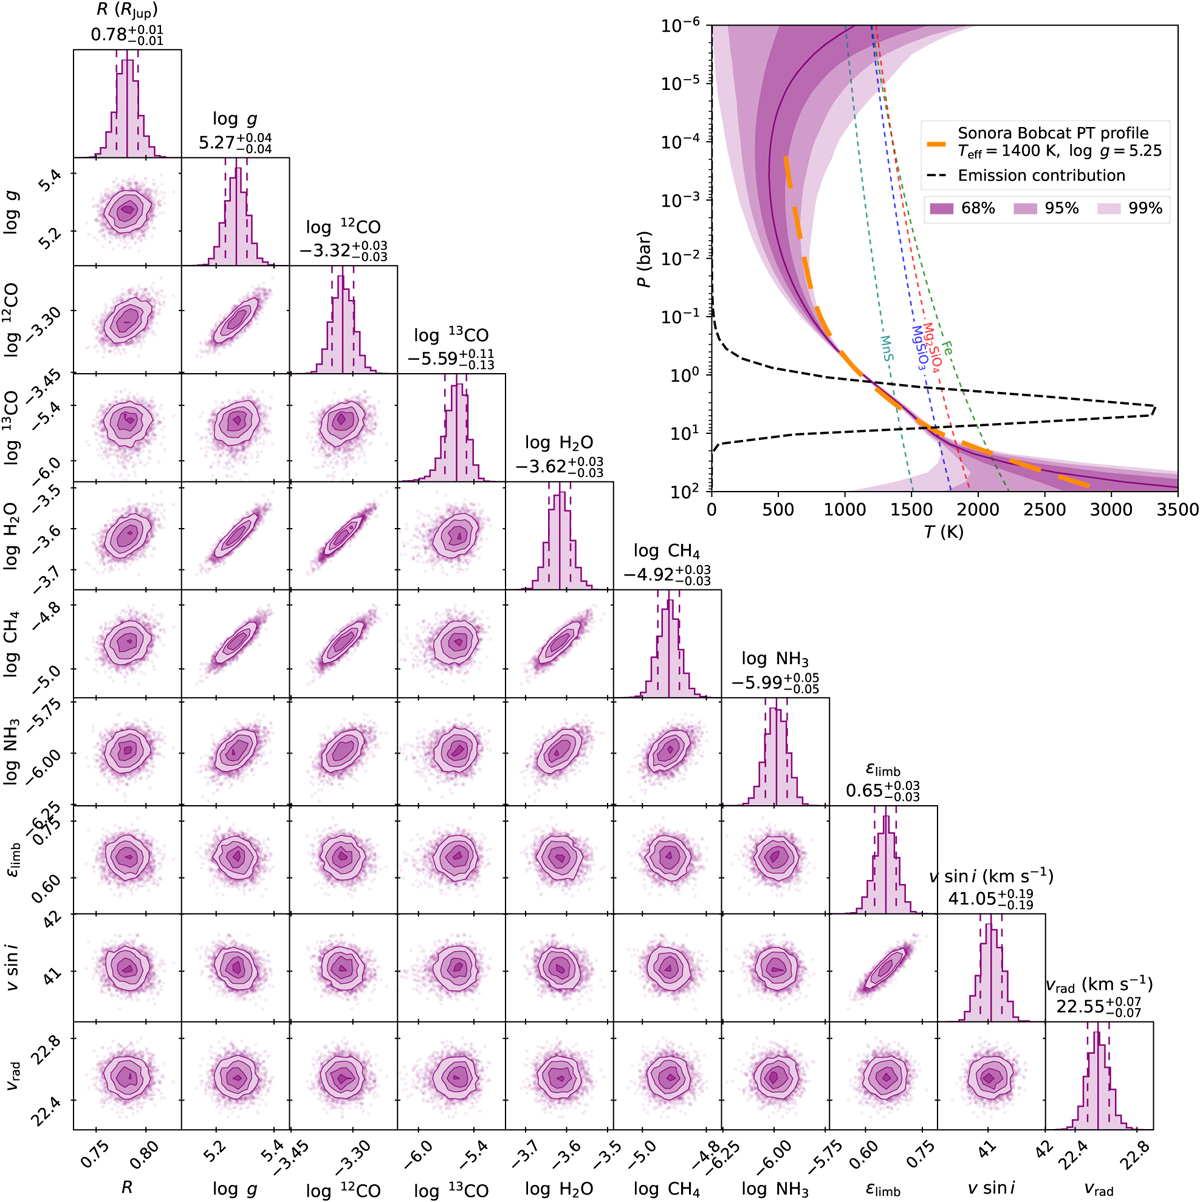
Posterior distributions and thermal structure of DENIS J0255’s atmosphere, retrieved using the fiducial model. Upper right panel: retrieved confidence envelopes of the PT profile. The solid purple line shows the median profile, with the shaded regions showing the 68, 95, and 99.7% confidence intervals. For comparison, a Sonora Bobcat PT profile is shown with an orange line, in addition to condensation curves of several cloud species (MnS: Visscher et al. 2006; MgSiO3, Mg2SiO4, Fe: Visscher et al. 2010). Lower left panels: retrieved physical, chemical, and kinematic parameters and their correlation. The posterior distributions of unconstrained parameters, in addition to those describing the GPs or the PT profile, are omitted for clarity. The vertical dashed lines in the histograms indicate the 16th and 84th percentiles, while the solid line shows the median value.
Current usage metrics show cumulative count of Article Views (full-text article views including HTML views, PDF and ePub downloads, according to the available data) and Abstracts Views on Vision4Press platform.
Data correspond to usage on the plateform after 2015. The current usage metrics is available 48-96 hours after online publication and is updated daily on week days.
Initial download of the metrics may take a while.