Fig. 4
Download original image
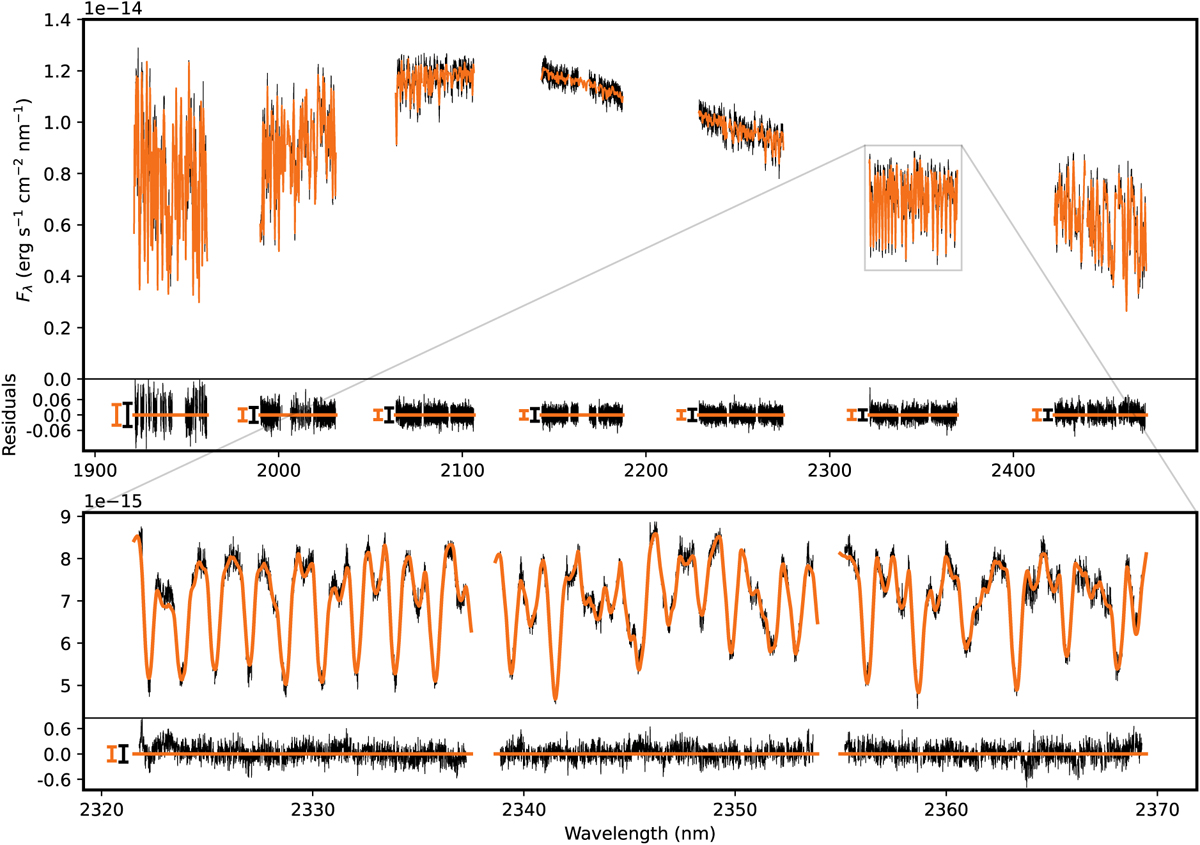
Best-fitting spectrum of the fiducial model, compared to the observed spectrum of DENIS J0255. Upper panels: similar to Fig. 3, the observed spectrum is plotted in black. The orange line displays the model spectrum and the second panel shows the residuals between the observed and model spectra in black. The mean photon noise of each order is indicated with a black error bar. The orange error bar shows the modelled uncertainty, defined as ![]() per order. Lower panels: zoom-in of the sixth spectral order, showing several correlated residual structures in the bottom panel.
per order. Lower panels: zoom-in of the sixth spectral order, showing several correlated residual structures in the bottom panel.
Current usage metrics show cumulative count of Article Views (full-text article views including HTML views, PDF and ePub downloads, according to the available data) and Abstracts Views on Vision4Press platform.
Data correspond to usage on the plateform after 2015. The current usage metrics is available 48-96 hours after online publication and is updated daily on week days.
Initial download of the metrics may take a while.