Fig. 3
Download original image
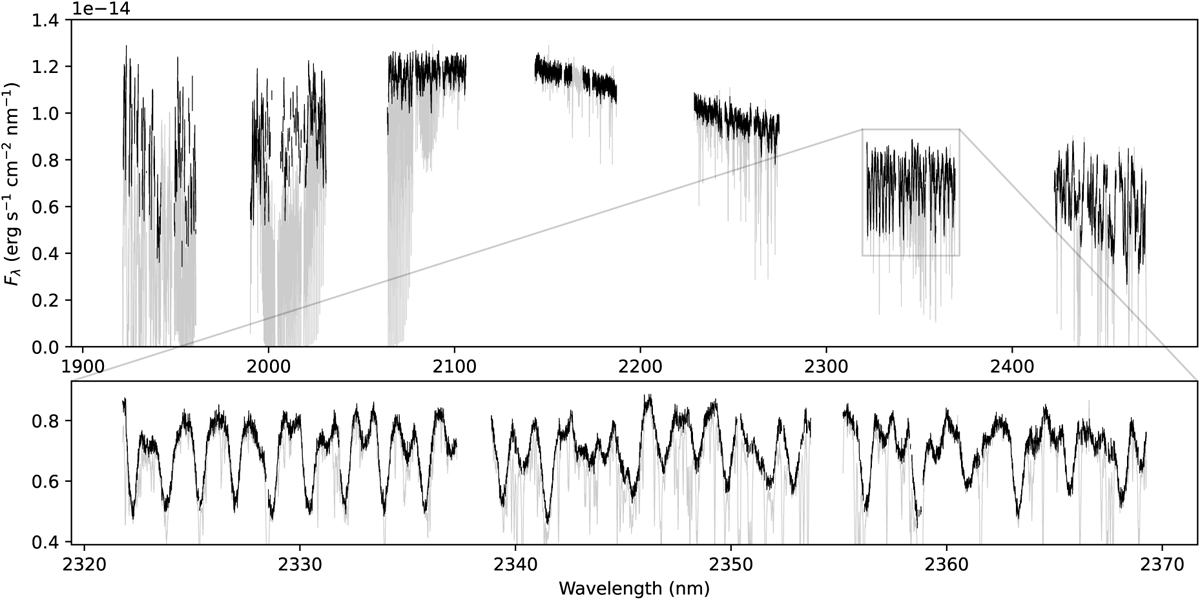
Calibrated spectrum of DENIS J0255, observed with CRIRES+ in the K2166 wavelength setting. The y axes indicate the flux Fλ in units of erg s−1 cm−2 nm−1 and the x axes denote the wavelength λ in nm. Top panel: spectrum over the full wavelength range, with the black line indicating the spectrum after the calibration described in Sect. 3.1. The grey line shows the observed spectrum without correcting for telluric absorption and removing outliers. Bottom panel: zoom-in of the sixth spectral order, presenting numerous rotationally broadened spectral lines of 12CO.
Current usage metrics show cumulative count of Article Views (full-text article views including HTML views, PDF and ePub downloads, according to the available data) and Abstracts Views on Vision4Press platform.
Data correspond to usage on the plateform after 2015. The current usage metrics is available 48-96 hours after online publication and is updated daily on week days.
Initial download of the metrics may take a while.