Fig. 17.
Download original image
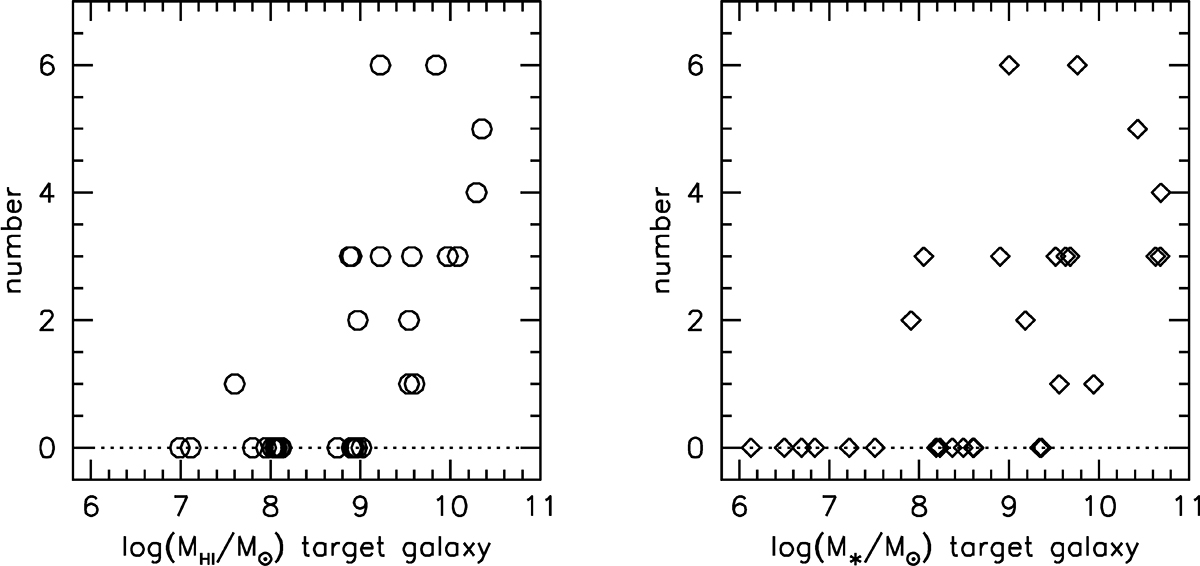
Number of additional galaxies in a 1.5° × 1.5° area around the target galaxies, within a velocity range of −500 to +500 km s−1 with respect to the central velocity of the target galaxy. This number is plotted against the H I mass of the target galaxy in the left panel and against the stellar mass in the right panel. Note the sudden increase at MH I ∼ 109 M⊙ (left) and M⋆ ∼ 108 M⊙ (right).
Current usage metrics show cumulative count of Article Views (full-text article views including HTML views, PDF and ePub downloads, according to the available data) and Abstracts Views on Vision4Press platform.
Data correspond to usage on the plateform after 2015. The current usage metrics is available 48-96 hours after online publication and is updated daily on week days.
Initial download of the metrics may take a while.