Open Access
Fig. 10.
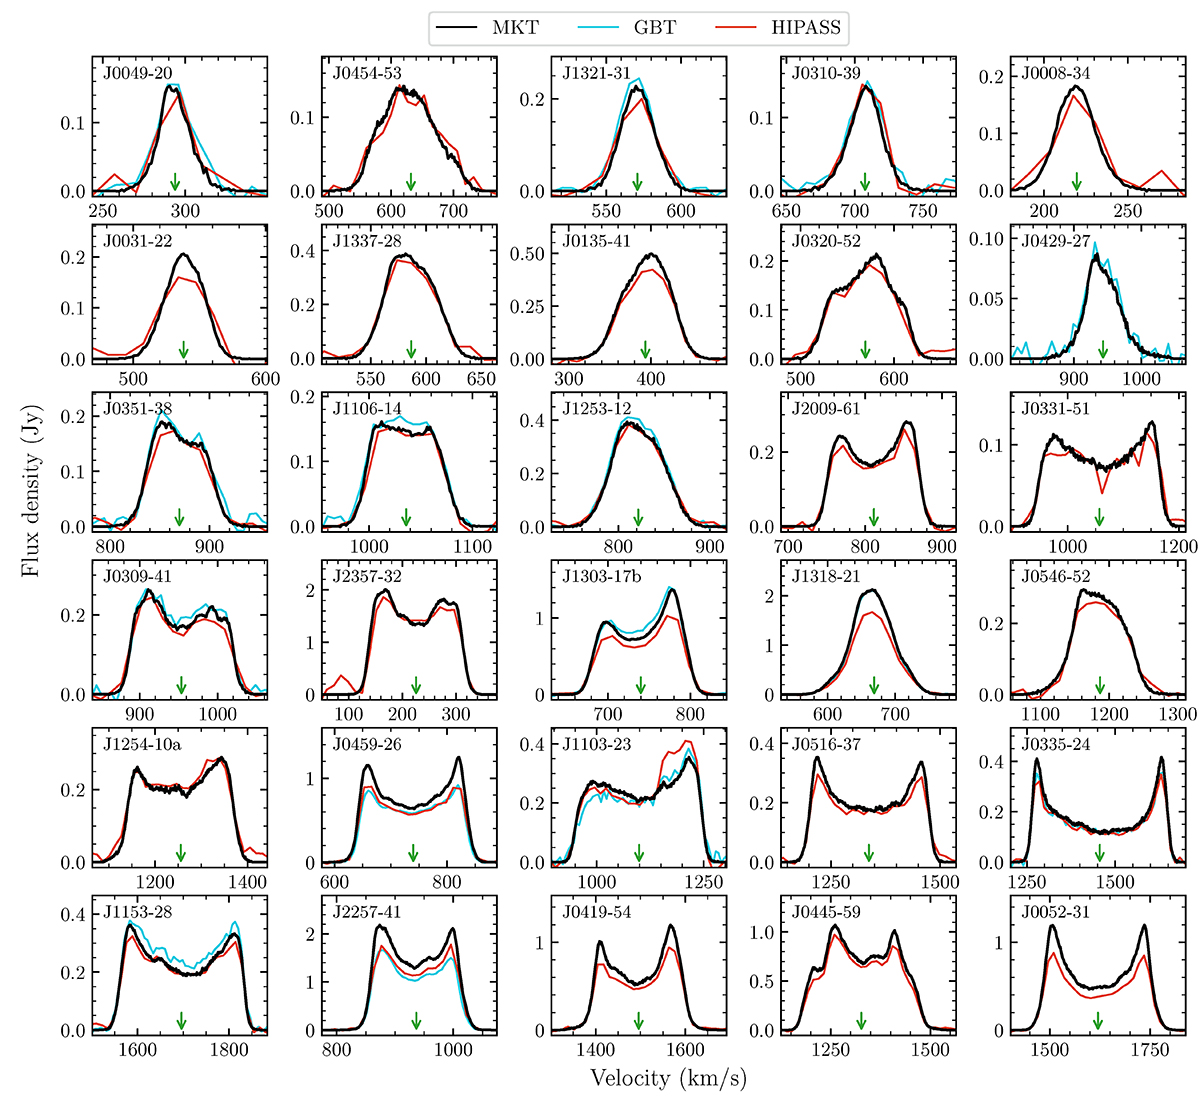
Download original image
Comparison of the MeerKAT and single-dish profiles. MeerKAT r15_t00 profiles are shown in black, GBT profiles (Sardone et al. 2021) in cyan, and HIPASS profiles (Koribalski et al. 2004) in red. The green arrows indicate the central velocties as derived from the MeerKAT data.
Current usage metrics show cumulative count of Article Views (full-text article views including HTML views, PDF and ePub downloads, according to the available data) and Abstracts Views on Vision4Press platform.
Data correspond to usage on the plateform after 2015. The current usage metrics is available 48-96 hours after online publication and is updated daily on week days.
Initial download of the metrics may take a while.