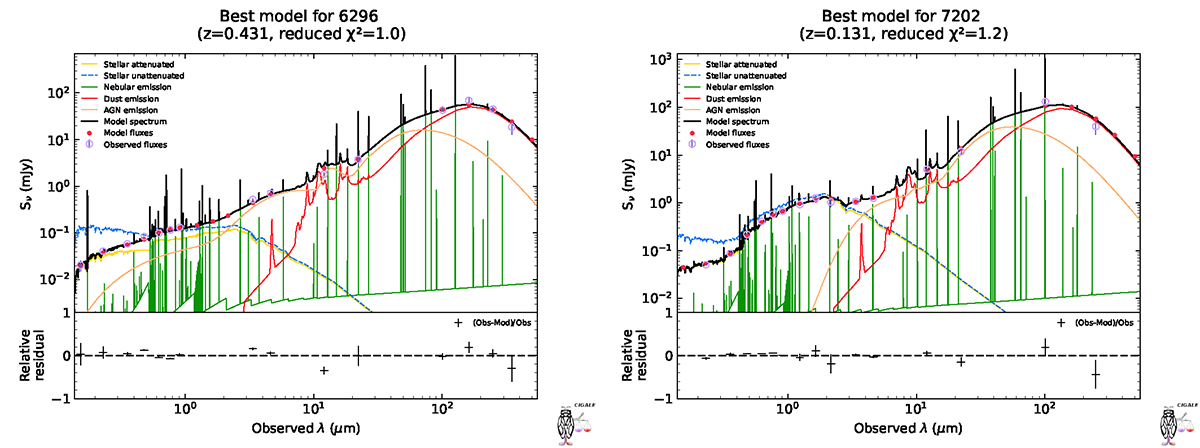
Fig. 1.
Download original image
Examples of the observed SED along with the best-fit SED from CIGALE for one NLS1 galaxy (left panel) and one BLS1 galaxy (right panel). The open and filled symbols correspond to the observed and modelled flux densities. The goodness of the fit, represented by the reduced χ2, is given at the top of each plot. The residuals of the fit are given at the bottom of each panel.
Current usage metrics show cumulative count of Article Views (full-text article views including HTML views, PDF and ePub downloads, according to the available data) and Abstracts Views on Vision4Press platform.
Data correspond to usage on the plateform after 2015. The current usage metrics is available 48-96 hours after online publication and is updated daily on week days.
Initial download of the metrics may take a while.