Fig. A.3.
Download original image
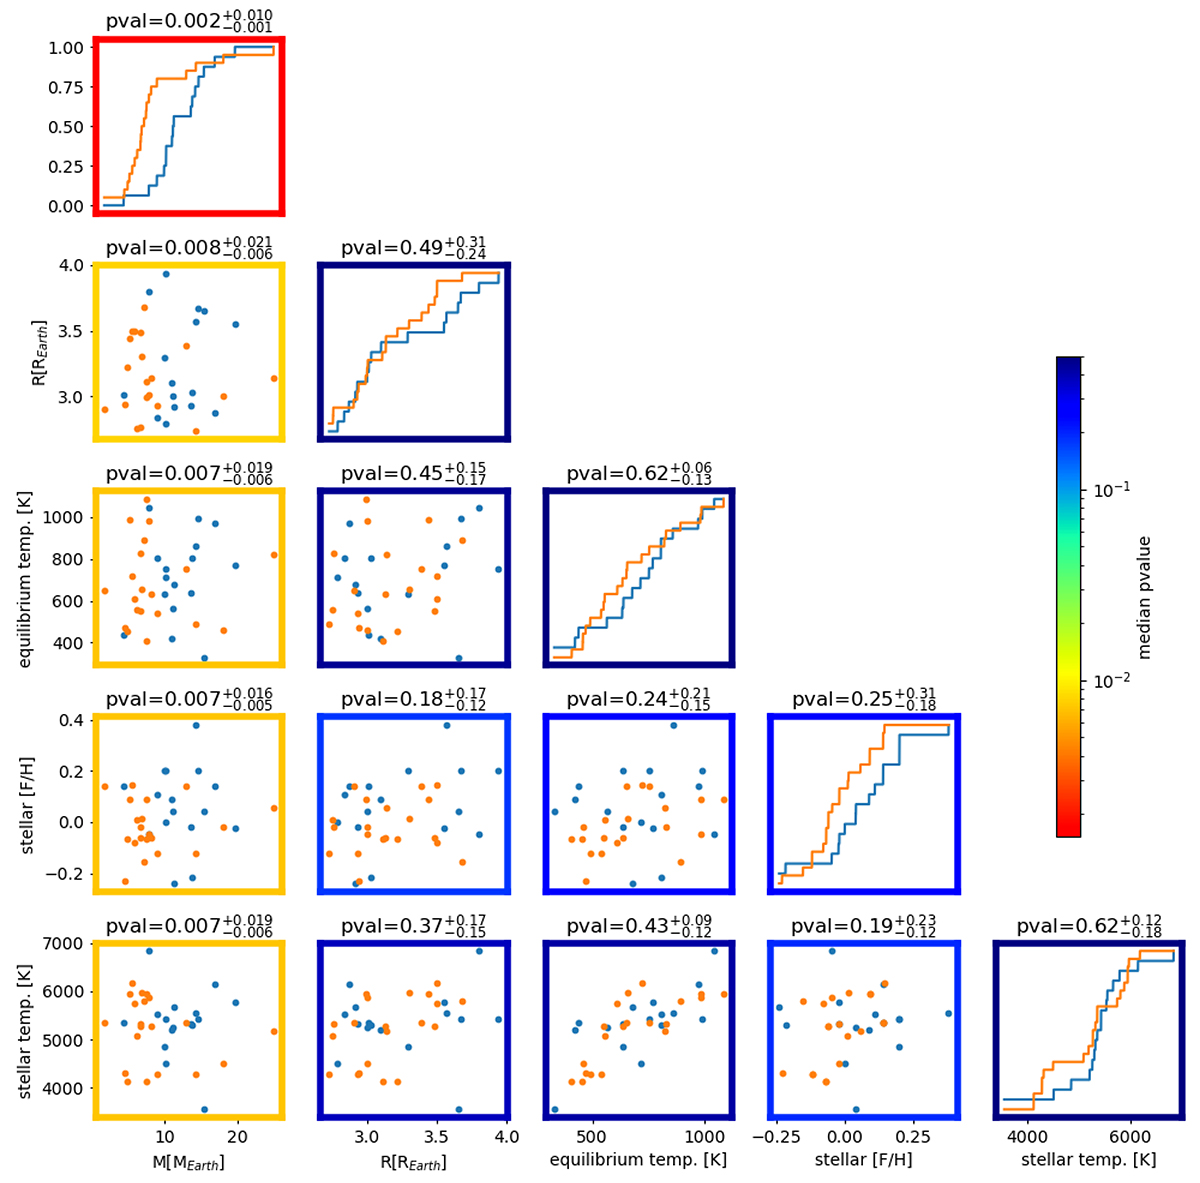
Controlled sample for planets in the 2.7 to 4 REarth range. (Nearly-)resonant planets are shown by orange points, while non-resonant planets are shown by blue points. The pvalue shown on the diagonal are 1D Kolmogorov-Smirnov test, while the pvalue on the bottom-left triangle are 2D Kolmogorov-Smirnov tests (Peacock 1983). Median and uncertainties on the pvalue are estimated by drawing 1000 samples assuming a Gaussian distribution for the radius of each planet, then computing the 0.16, 0.5, and 0.84th quantiles of the resulting pvalue distribution.
Current usage metrics show cumulative count of Article Views (full-text article views including HTML views, PDF and ePub downloads, according to the available data) and Abstracts Views on Vision4Press platform.
Data correspond to usage on the plateform after 2015. The current usage metrics is available 48-96 hours after online publication and is updated daily on week days.
Initial download of the metrics may take a while.