Fig. 1.
Download original image
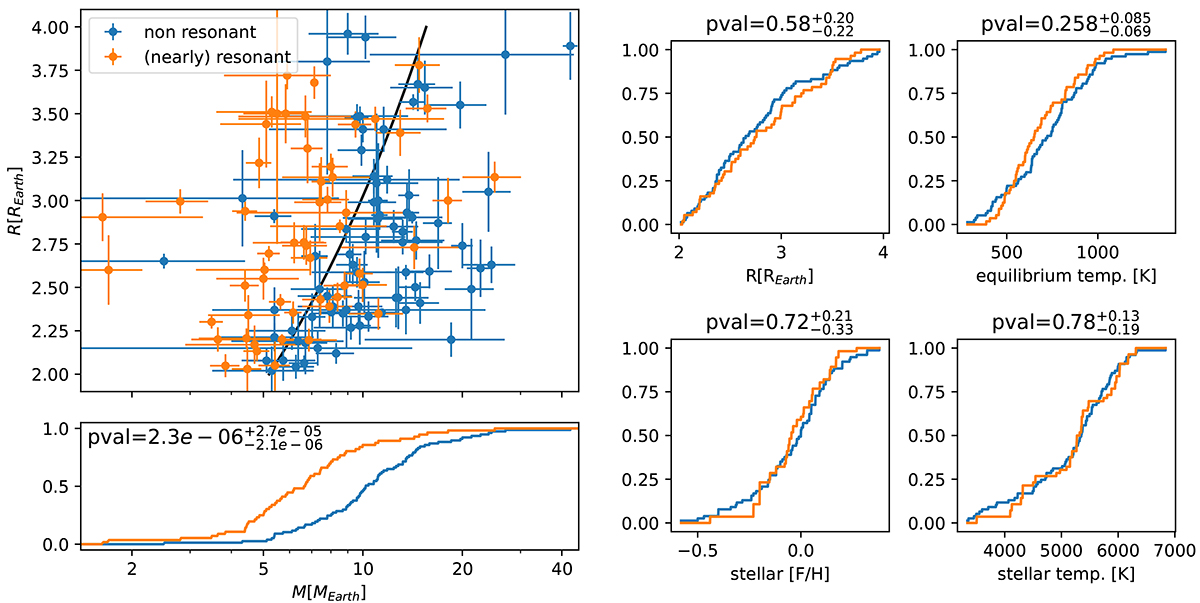
Full sample of 133 sub-Neptunes used in this study. The top-left panel shows the mass–radius relation. The (nearly)-resonant population is defined as ΔMMR < 0.05 (see Eq. (1)), while the non-resonant population is defined as ΔMMR > 0.05. The black line is the sub-Neptune mass–radius relation from Parc et al. (2024). Other panels show the cumulative distributions for parameters of the planets or their host star. The pvalue given for each parameter is the probability that the distribution of that parameter is drawn form the same underlying distribution for the (nearly) resonant and non-resonant populations. The potential 2D correlation between parameters is explored in Fig. B.1.
Current usage metrics show cumulative count of Article Views (full-text article views including HTML views, PDF and ePub downloads, according to the available data) and Abstracts Views on Vision4Press platform.
Data correspond to usage on the plateform after 2015. The current usage metrics is available 48-96 hours after online publication and is updated daily on week days.
Initial download of the metrics may take a while.